400 - Scanning and execution
Trade ideas and signals
In addition to the scanners we discussed in the previous lessons, you can also discover trade ideas through time and sales data, the market intelligence tab, and the signal builder.
Trade ideas
First, let's go over the most popular place to find trade ideas - in a tab aptly named Trade Ideas. Trade ideas aren't just ideas anymore - we backtest every trade idea so that you can make better decisions rooted in historical data. You can find the trade's annual margin return going back to 2007, the max drawdown %, and 35 other performance metrics to go along with a detailed trade log.
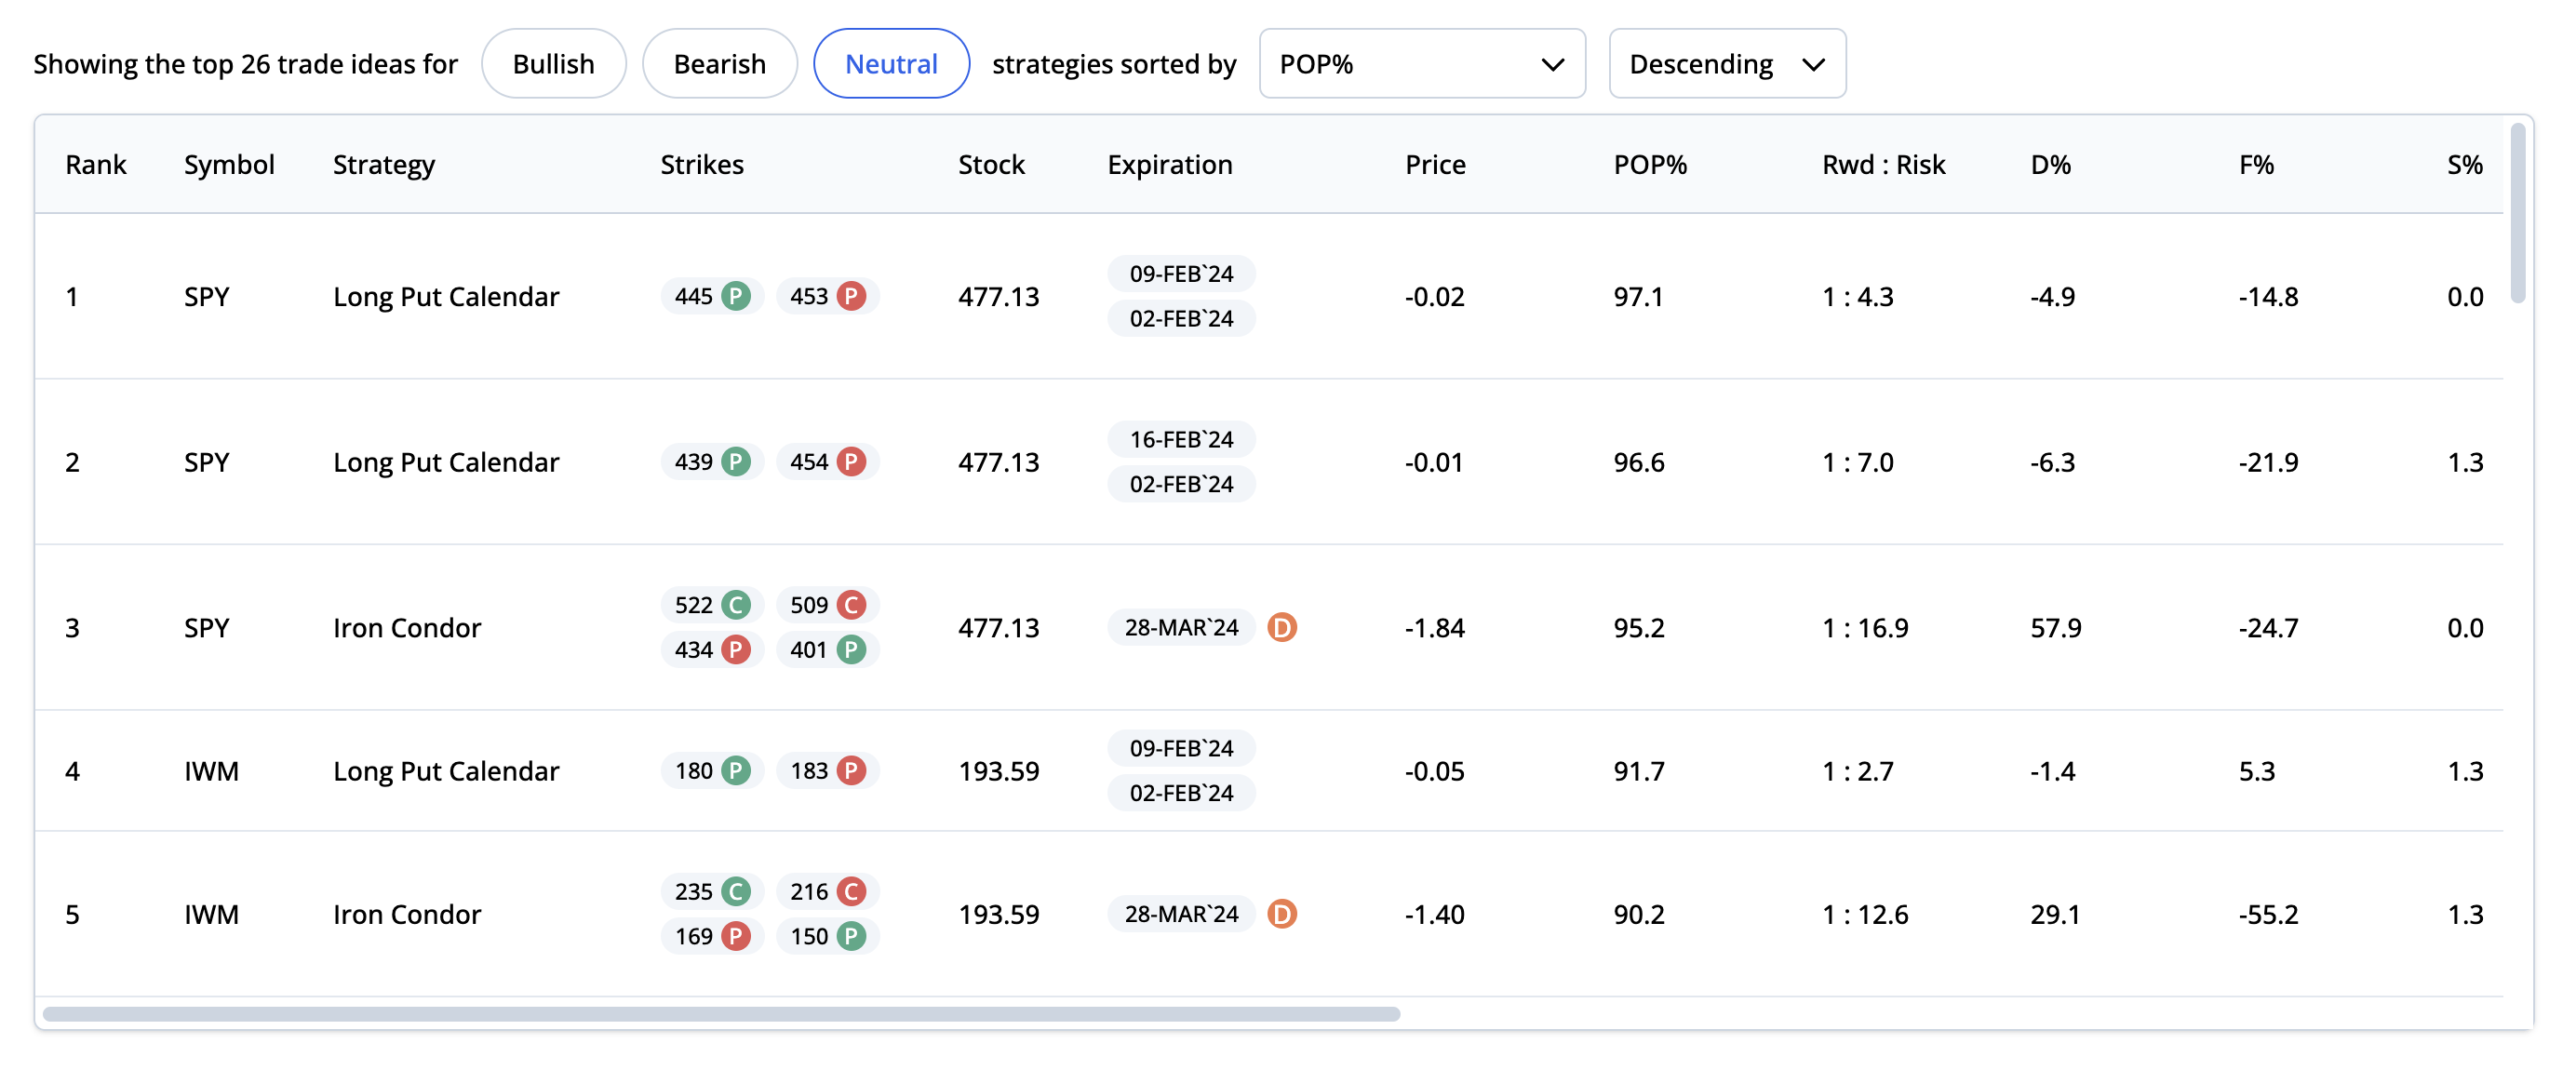
To find the top trades for today, we first rank all of our pre-compiled backtests across all symbols and strategies by best return on risk, filtering those with entry triggers that match the current environment (VIX, SMA, RSI, IV Percentile, and slope percentile). Then for each of the top performing backtested strategies, we scan to find the best options trade ranked by POP%, risk/reward, and theoretical edge. This table updates every ten minutes.
Time and sales
Another way to generate trade ideas is by analyzing time and sales data for individual stocks. We look at the raw order flow and detect the largest trades coming through the market. In addition to the strategy and contract size, you can also find the trade amount (in dollars), theoretical edge (compared to our theoretical price), and the contracts / avg. option volume 20d (to see the relative size of the position). You can sort on all of these metrics.
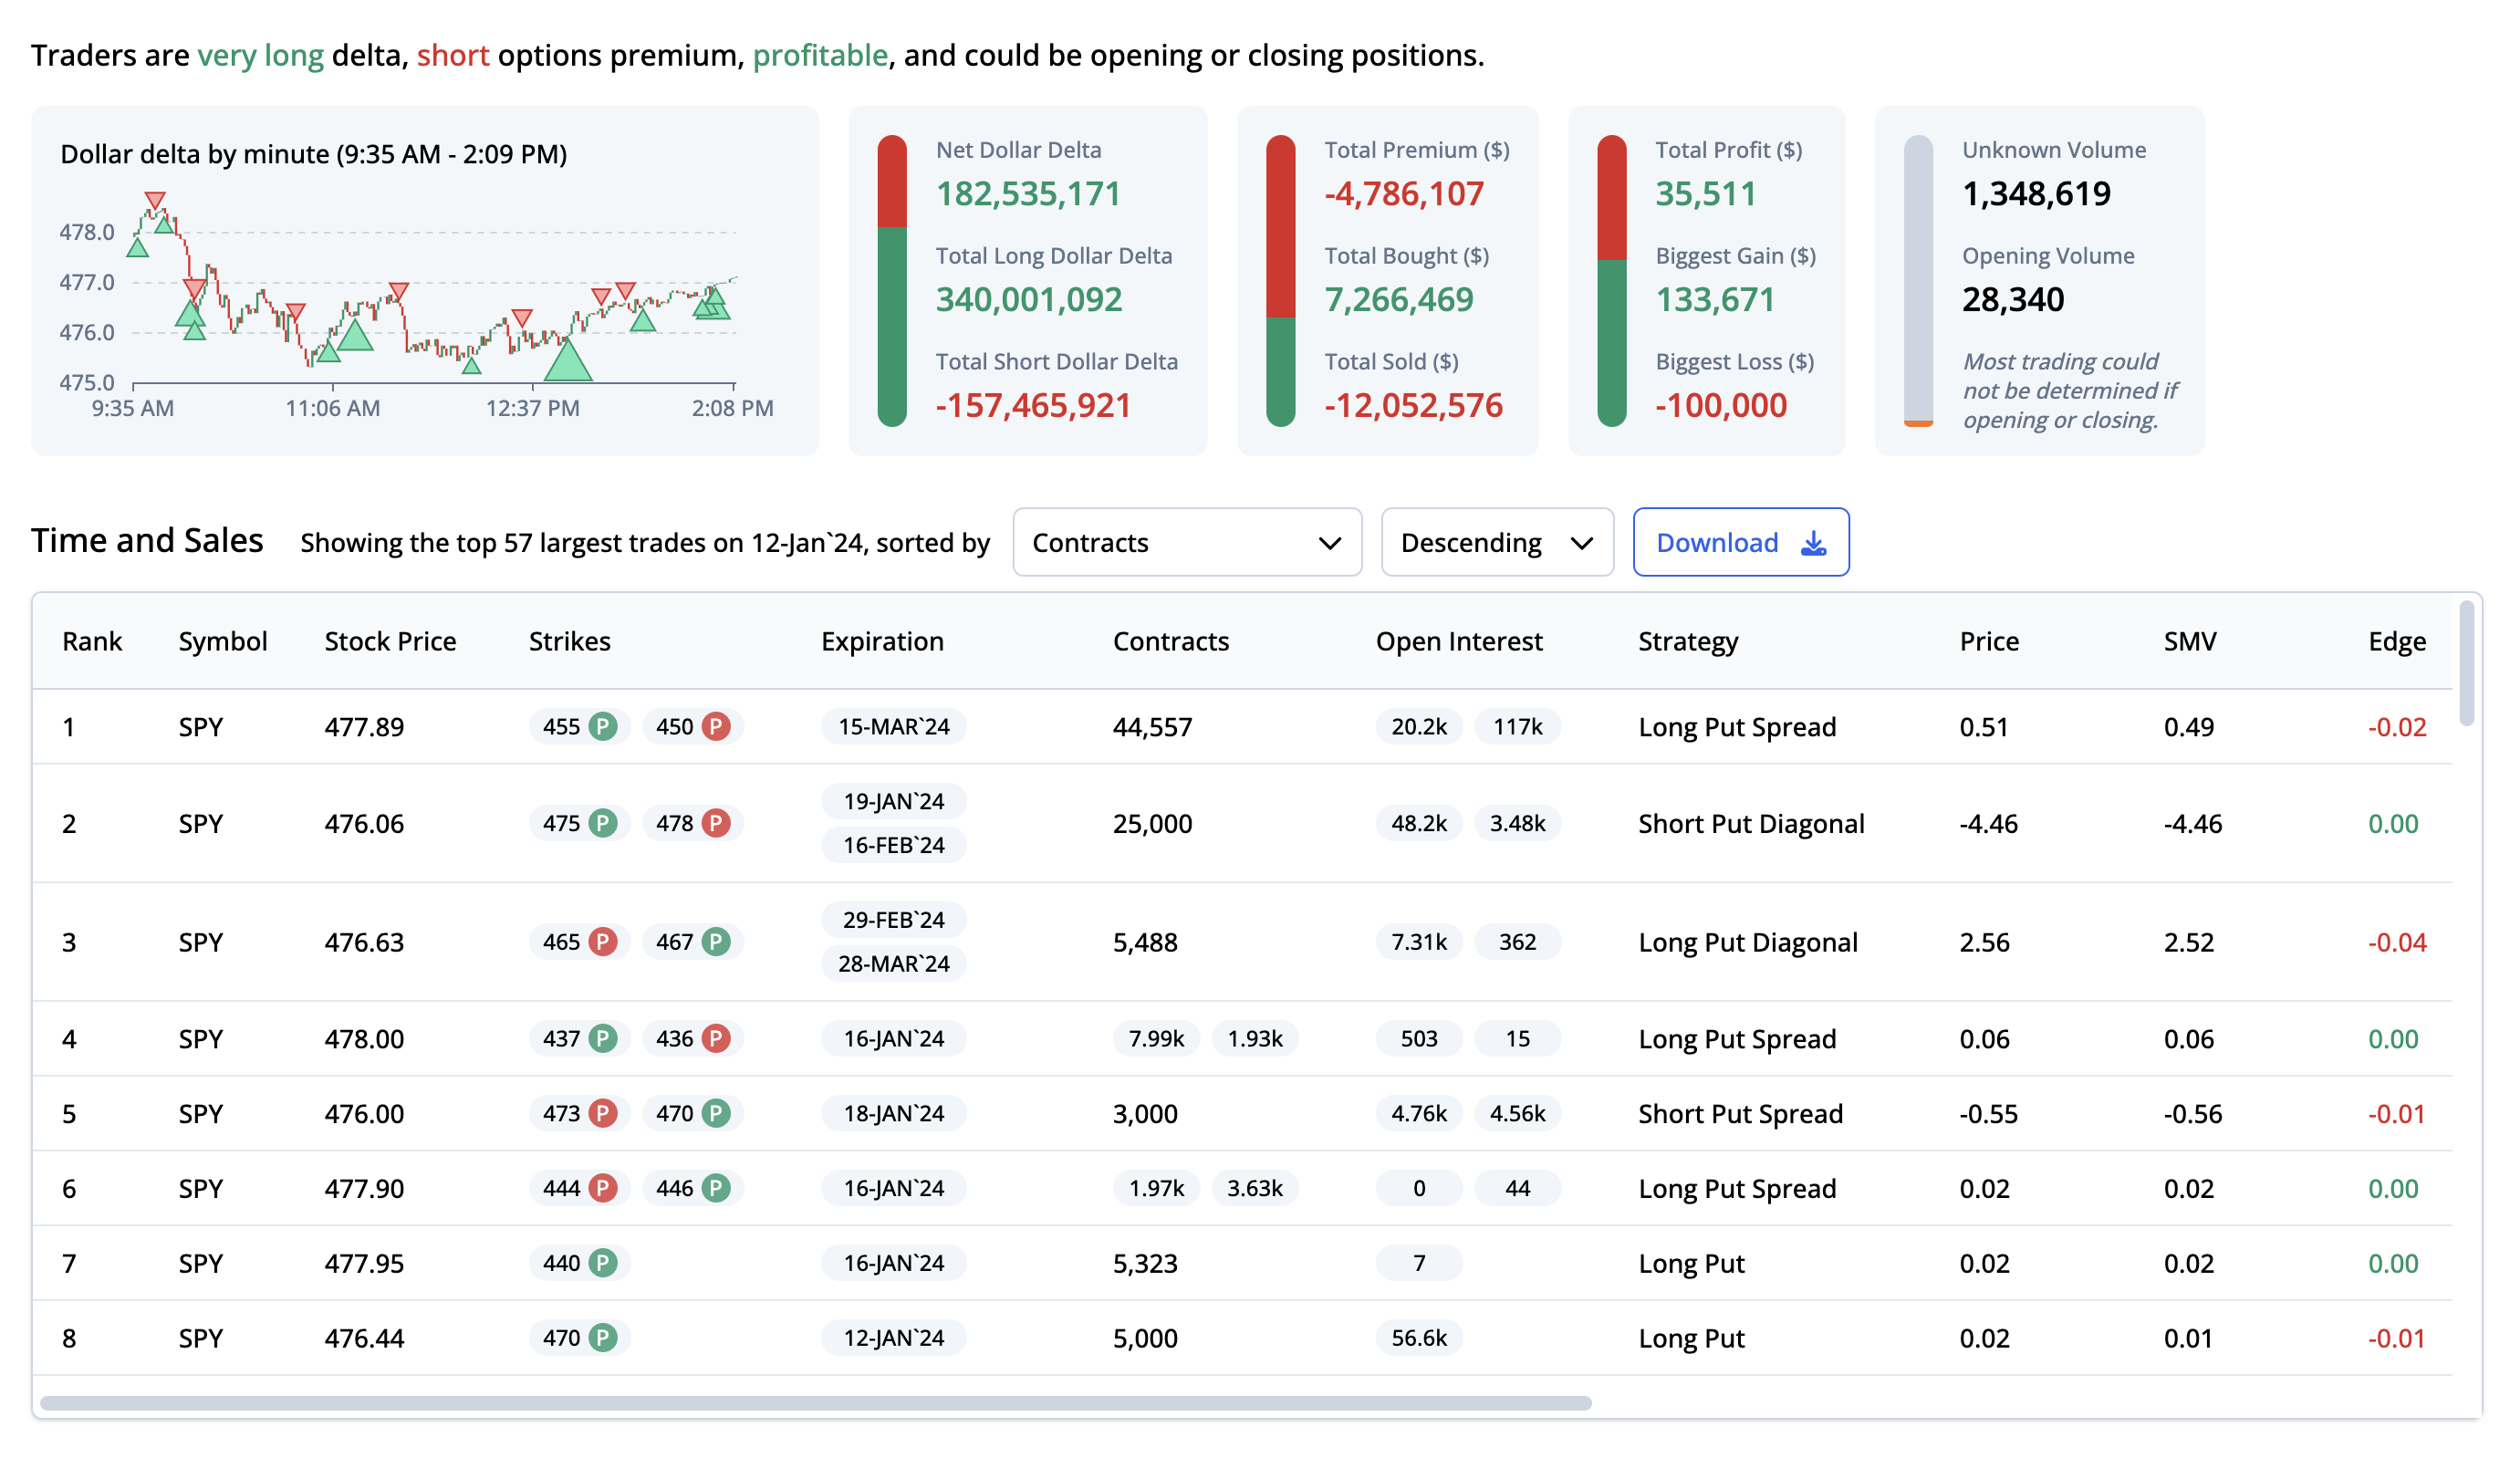
Additionally, ORATS presents an intraday chart of dollar delta plus a summary of total premium, total profit, and opening vs. unknown volume. Analyzing these metrics can help you form a well-crafted trading thesis.
Market intelligence
Uncover the largest trades made in the market today inside our Market Intelligence tab. Just like time and sales data for individual stocks, we scan the entire market so you can see which trades stand out – a helpful piece of information when developing a trading thesis. Here you can also find useful visuals for several market-wide reports, including unusual volume.
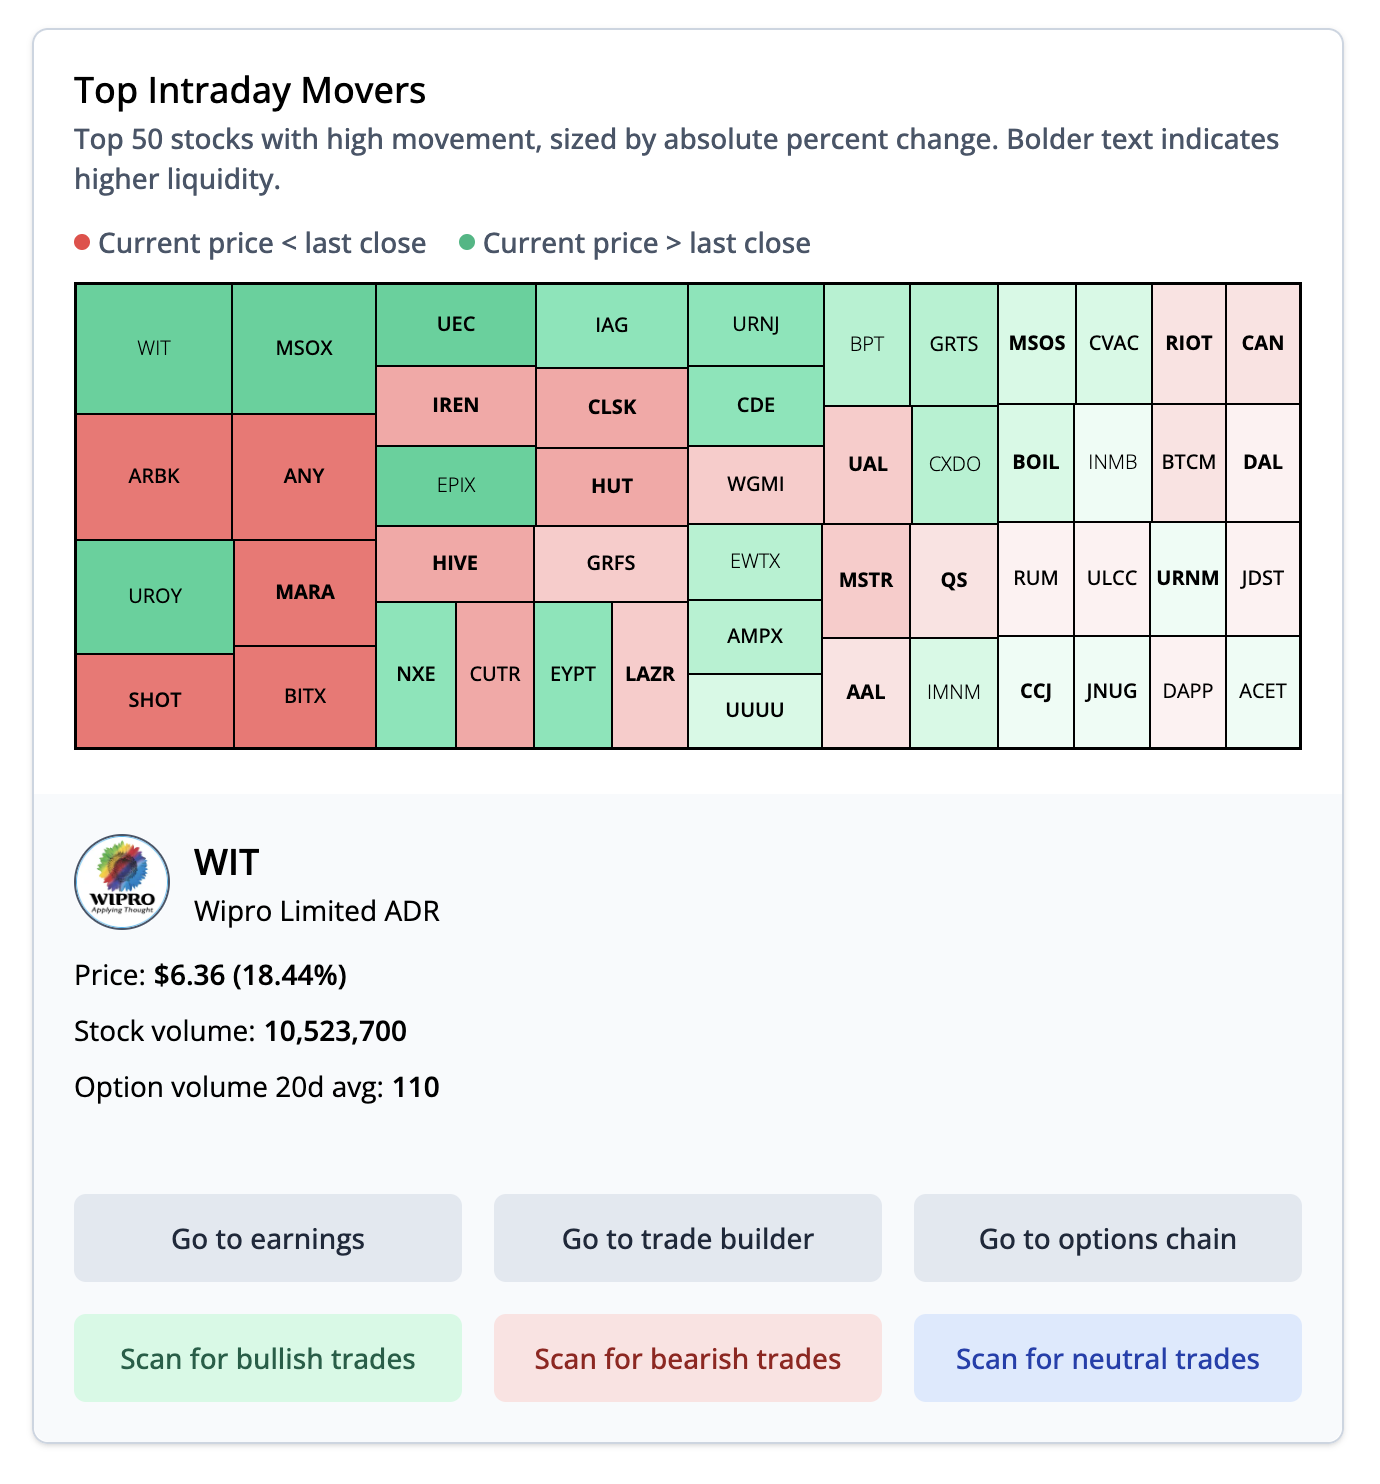
Top movers
In the top movers report, you can find the top 50 stocks with high movement, sized by absolute percent change, and colored green or red if the stock is up or down today. This is available during the pre-market, intraday, and post-market:
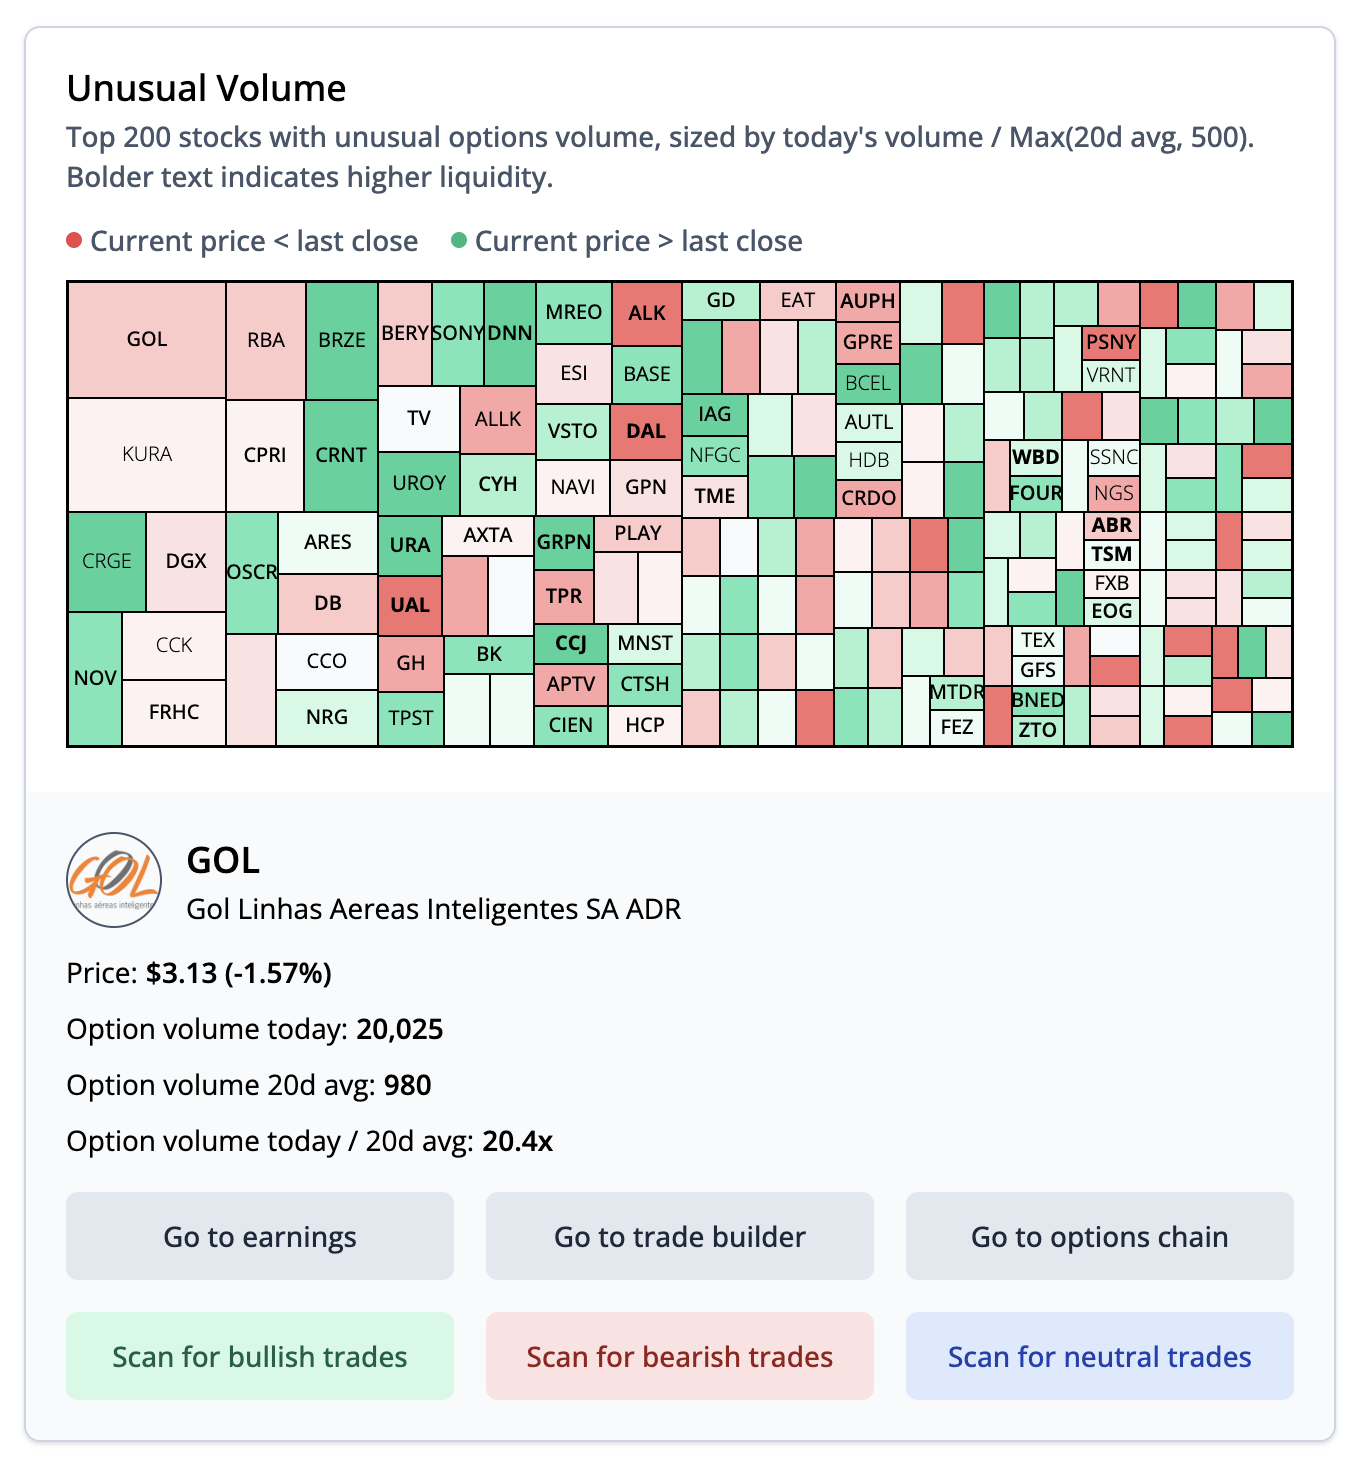
Unusual volume
In the unusual volume report, you can find the top 200 stocks with unusual options volume, sized by today's volume / avg. option volume 20d, and colored green or red if the stock is up or down today:
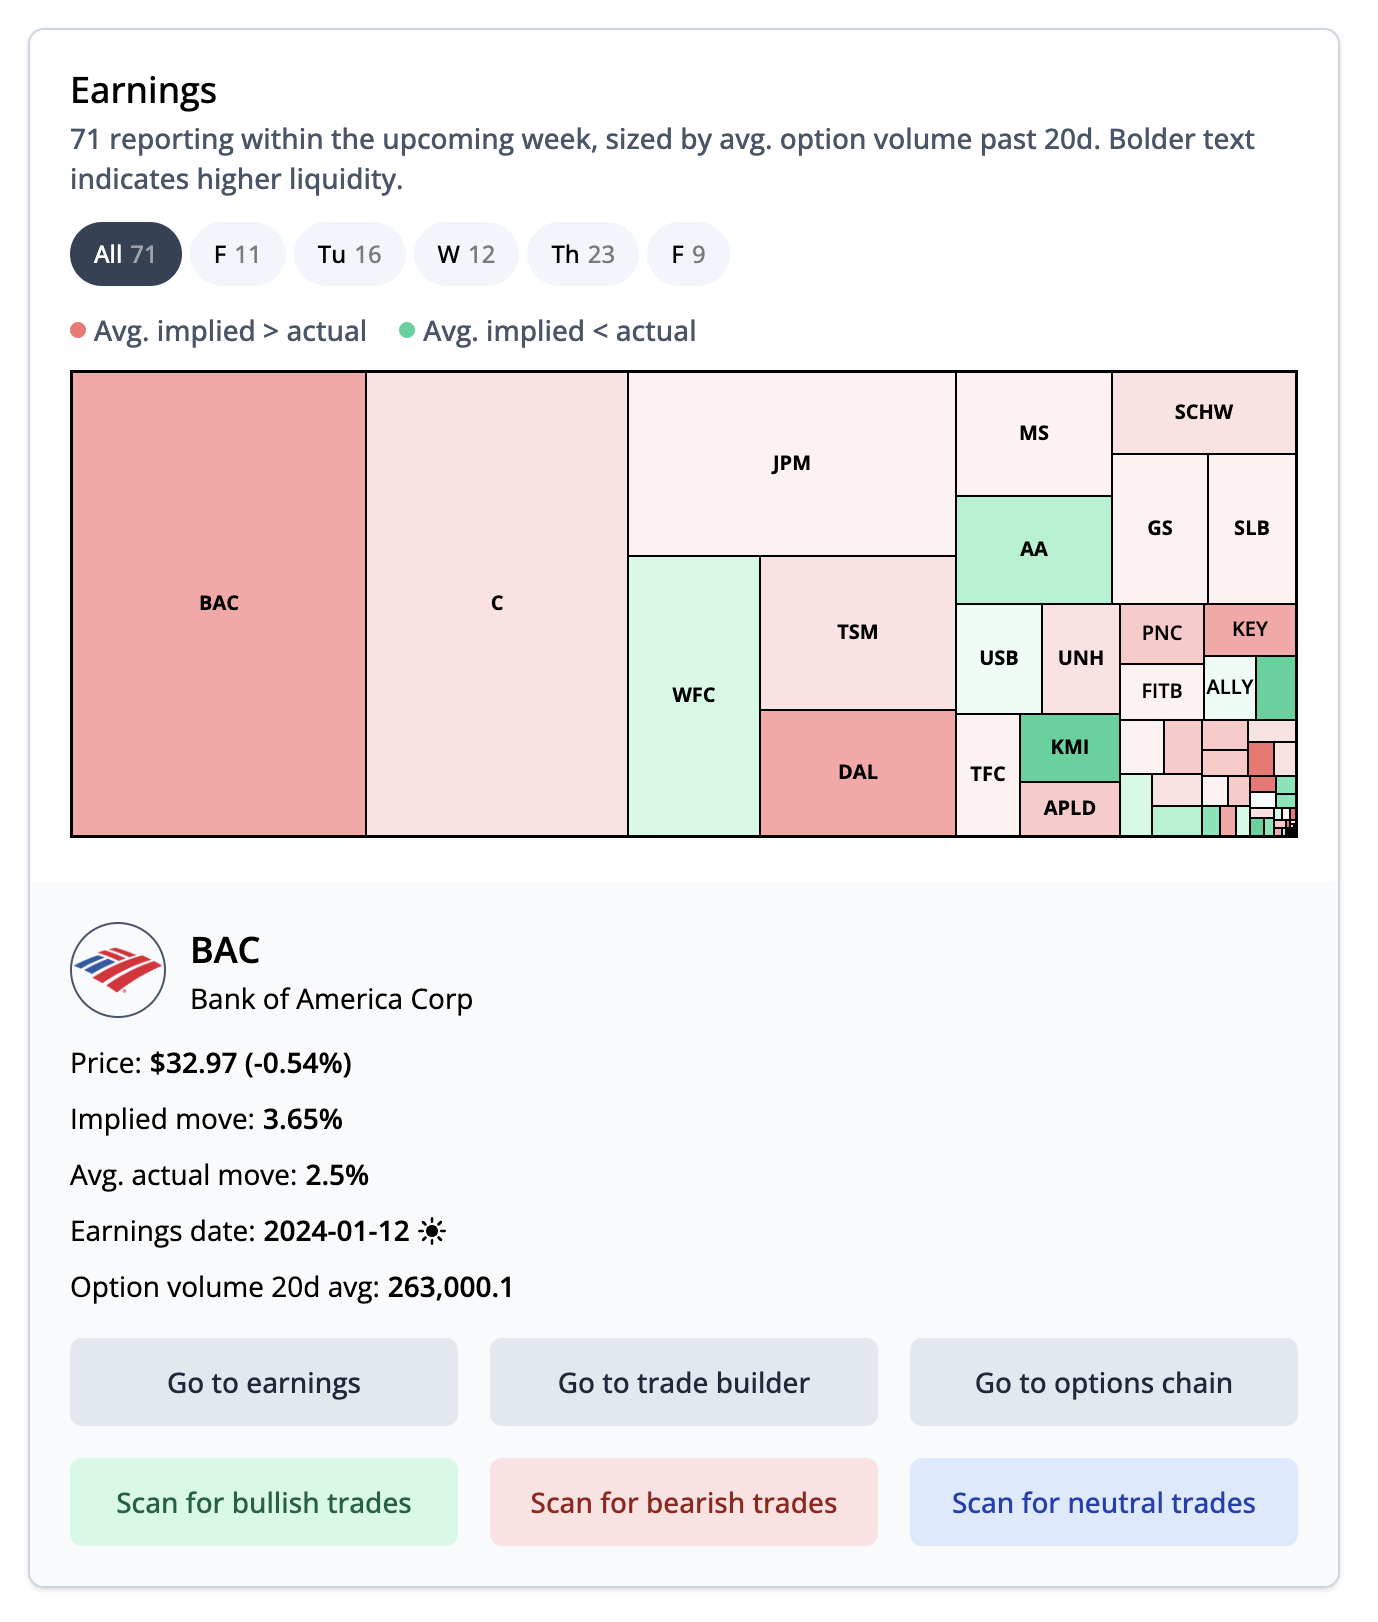
Earnings
In the earnings report, you can find all the stocks reporting earnings this week, sized by avg. option volume 20d, and colored green or red if the implied move is greater than or less than the average actual move:
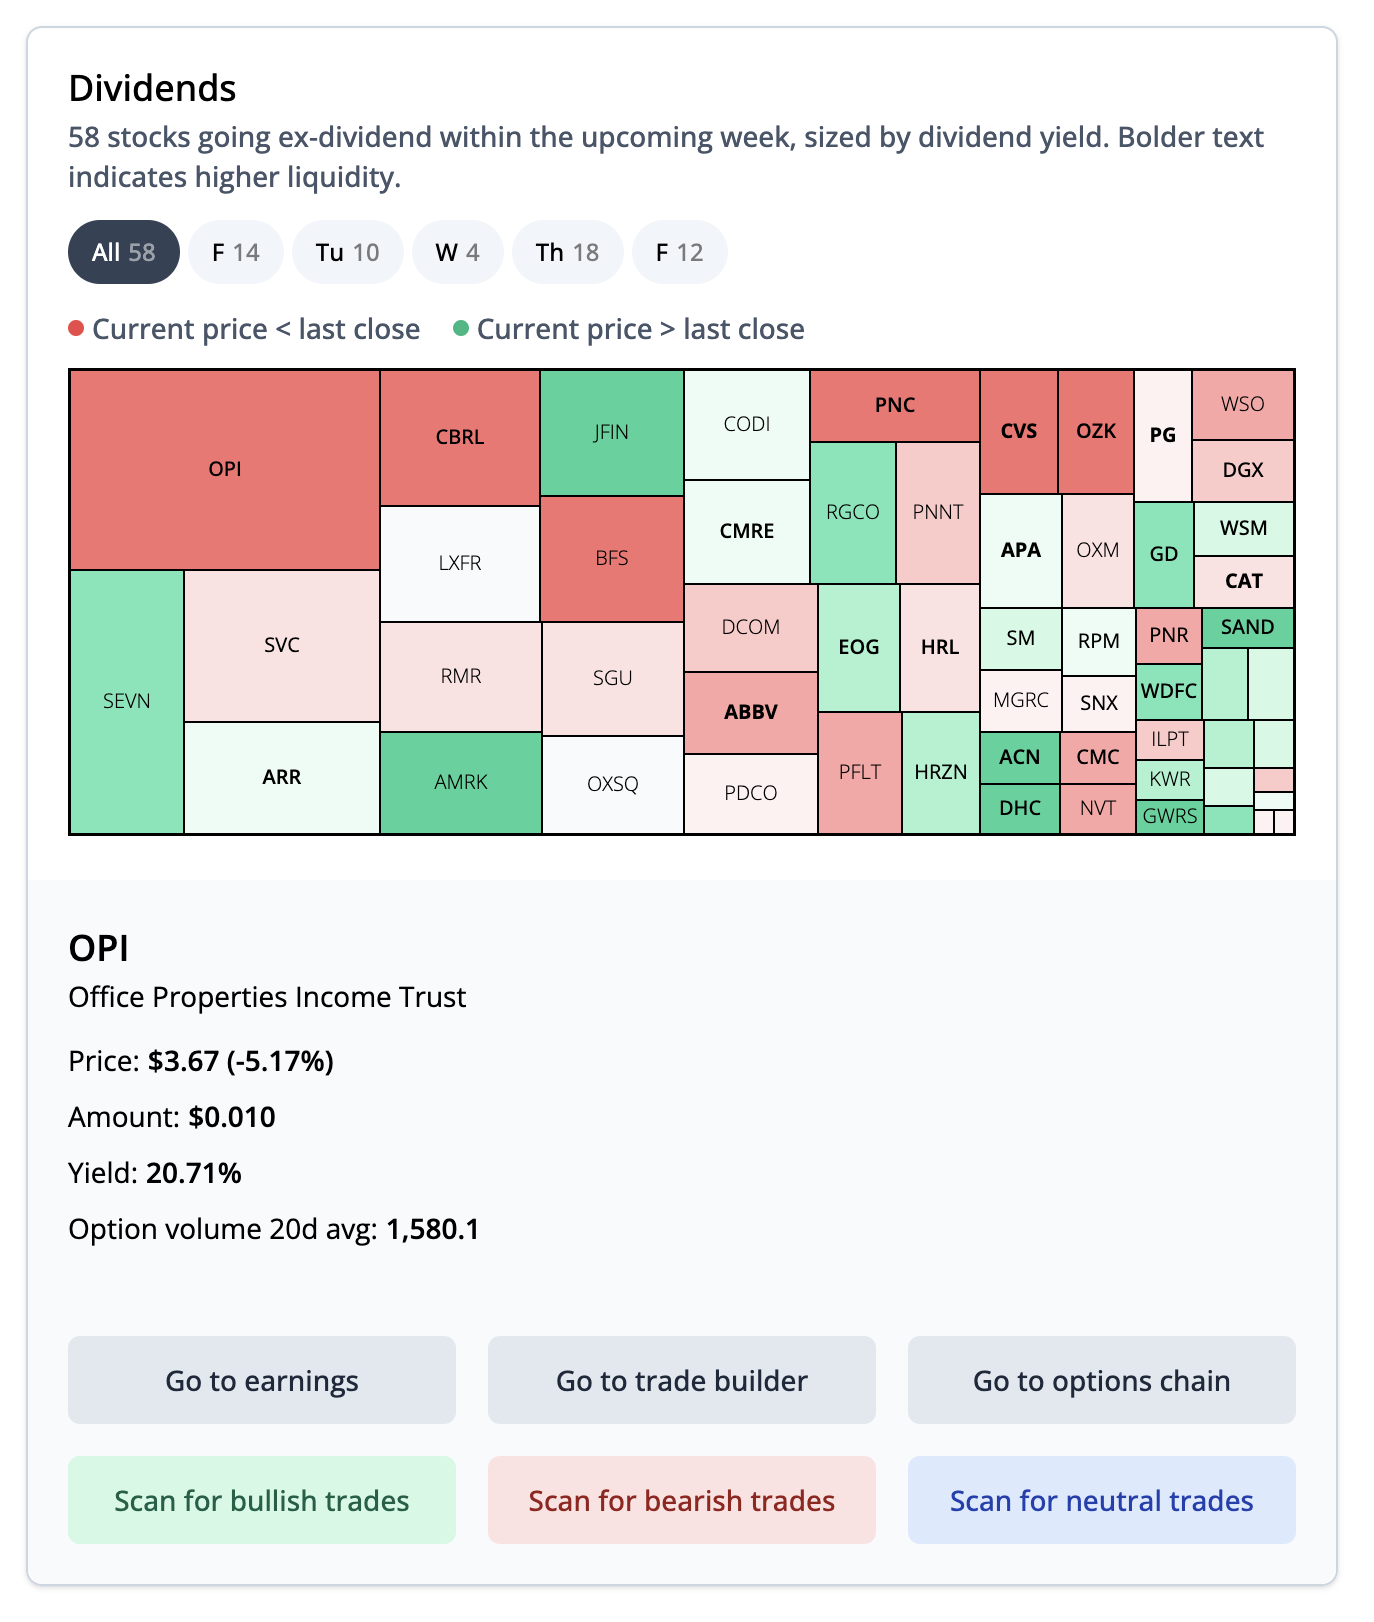
Dividends
Lastly, in the dividends report you can find all the stocks going ex-dividend this week, sized by dividend yield, and colored green or red if the stock is up or down today:
Signal builder
Yet another way to develop a trading thesis rests in the Signal Builder – a robust charting tool designed to help you create and backtest custom intraday (one-minute) signals with fast and slow moving averages, RSI, and criteria values from over 80 ORATS indicators.
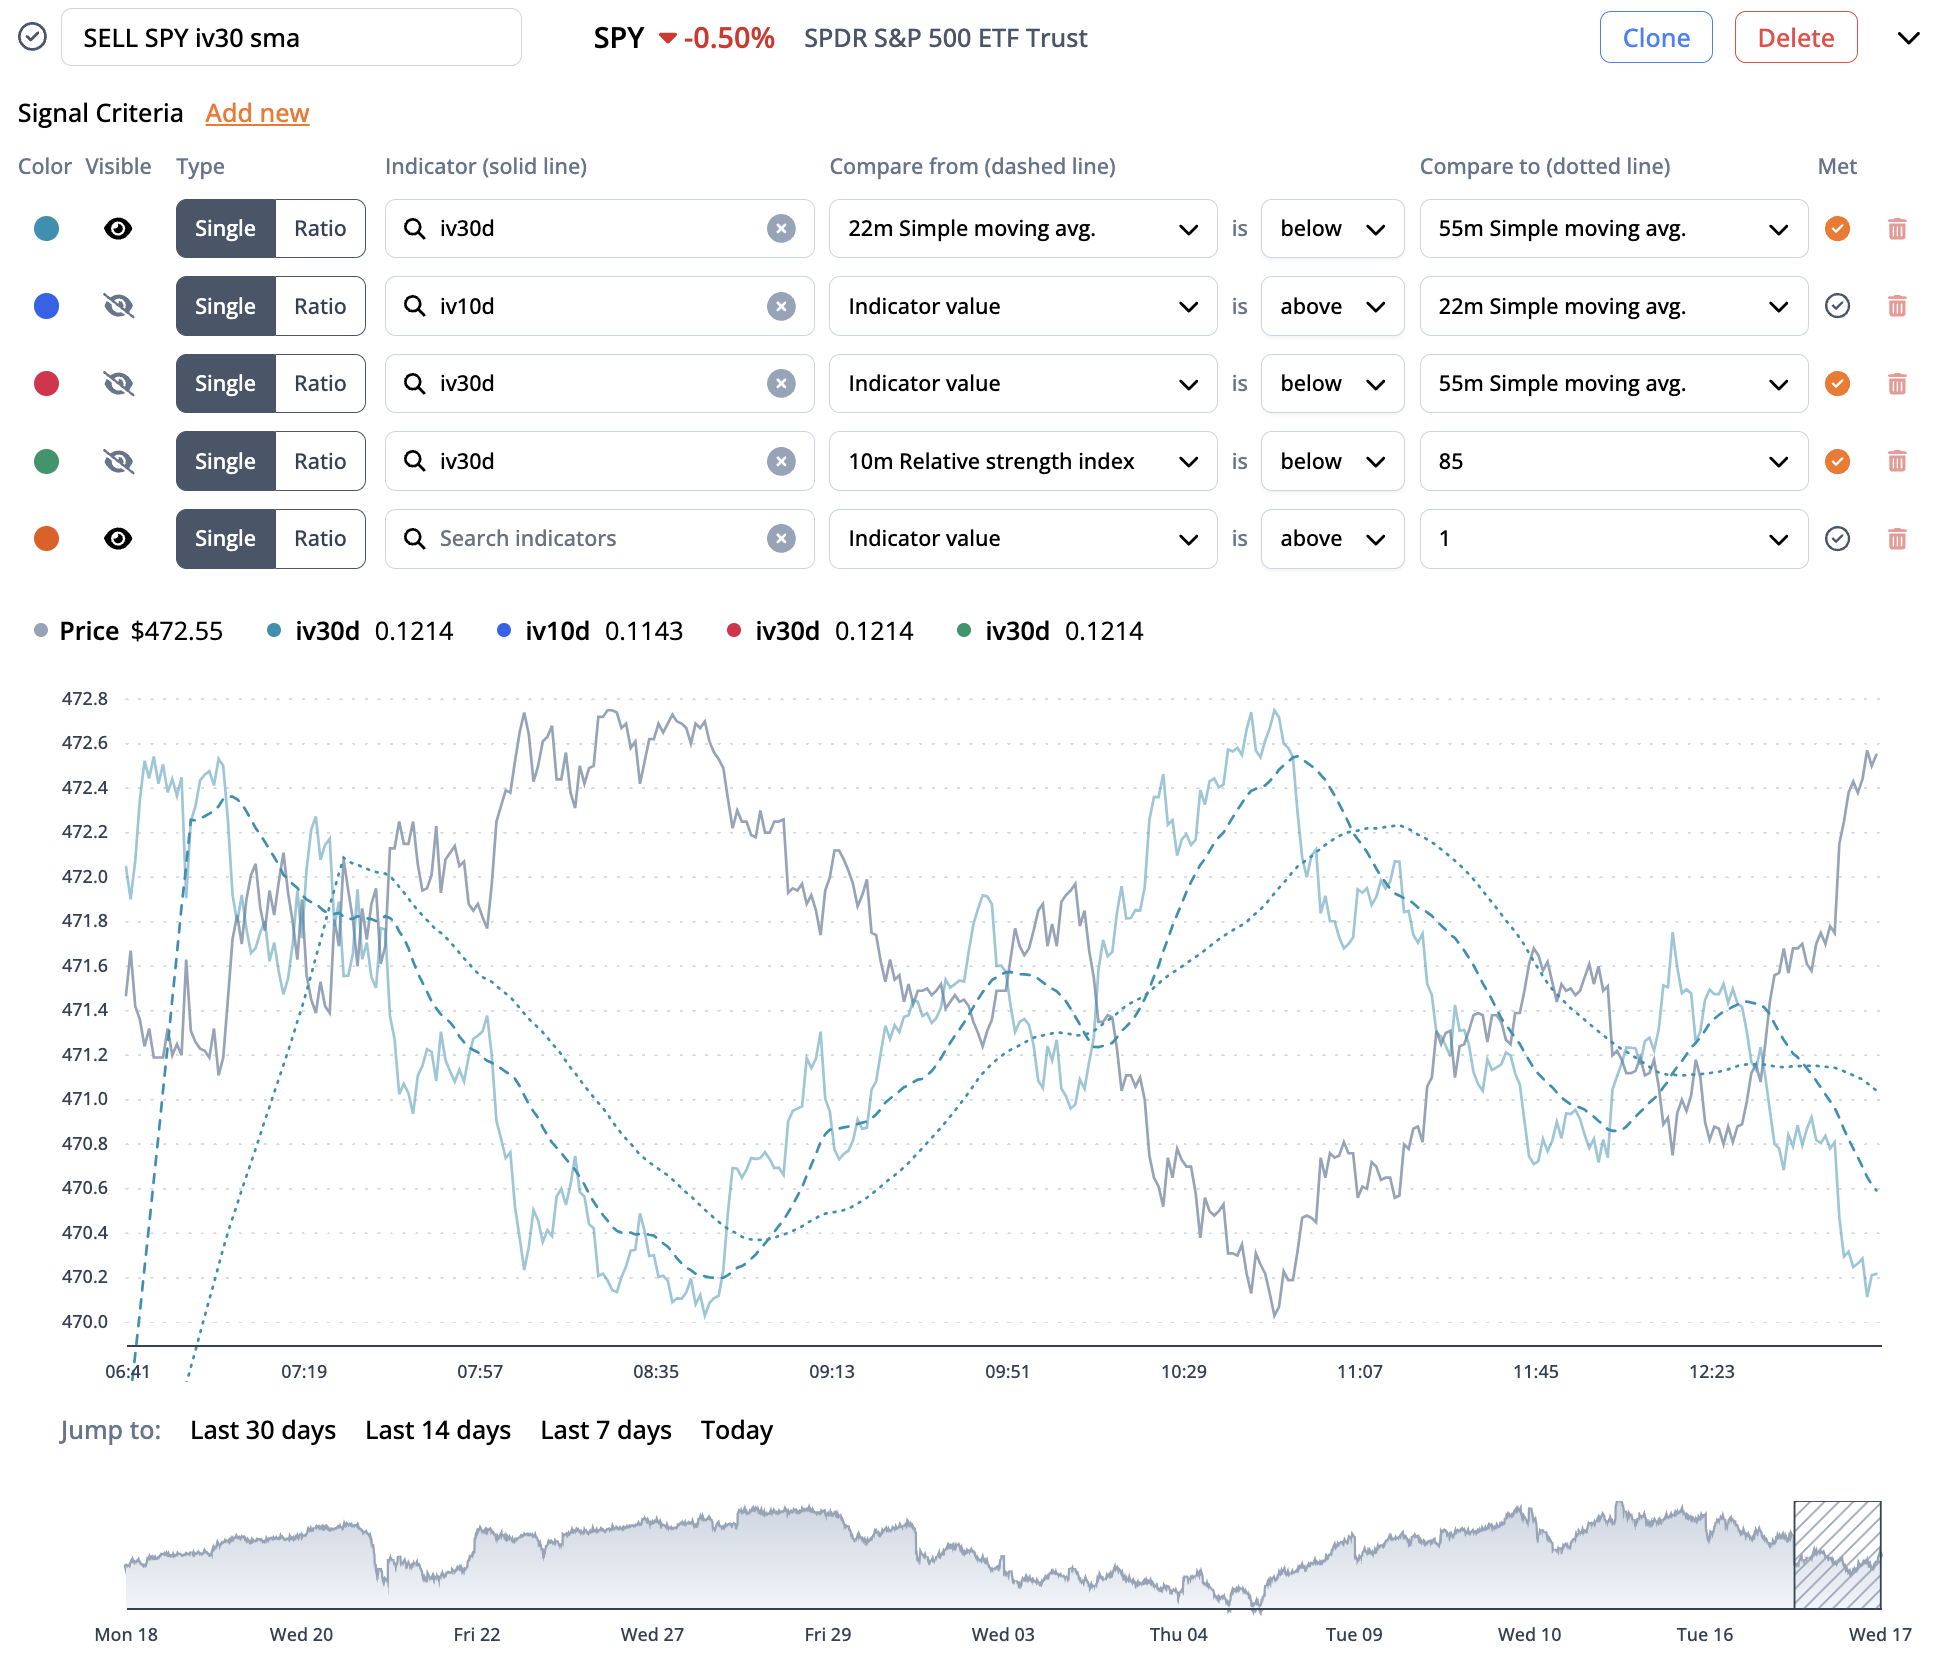
To build a signal, start by choosing from one of over 5,000 supported stocks, ETFs, or indexes. Then, add custom criteria to check when your signal is met. With over 80 proprietary indicators, you can create nearly infinite criteria combinations. For each indicator, choose from a variety of technicals to compare, such as simple moving average or relative strength index. You can customize what time period you want to use to compute these values.
Signals mean nothing if you can't backtest them! Powered by our Intraday Data API, you can backtest your custom signals every minute of the day for the last 30 days. The backtester includes various settings you can adjust to calculate performance. Drag and widen the view box slider to change your timeframe.
Wrapping it together
In this lesson, you learned a variety of ways to generate trade ideas. Combined with the stock and option scanner, you now have ample resources available to find the perfect trade that meets your investment objectives.
The next step in the implementation pillar is placing your order. This step requires prudent analysis and access to quality data to ensure you get executed at the right price.