400 - Scanning and execution
Stock scanning
The backtester is a great tool for exploring the viability of specific strategies in certain environments. However, there are times when you want to explore trading opportunities for the present moment. This is where scanning - part of our second pillar of implementation - comes into play.
What makes a great scanner
Scanners are used to narrow down an entire universe of stocks and options into a few considerable trades by applying filters to certain indicators. We know from the previous lesson about predictive indicators that slope, ex-earnings IV, contango, and others aren't very useful when measured by themselves, but become informative when we compare them to history, to forecasts, and to related equities. Fortunately, all of these points of comparison are availble in the ORATS stock scanner, which can scan over 5,000 tickers in a few seconds.
History
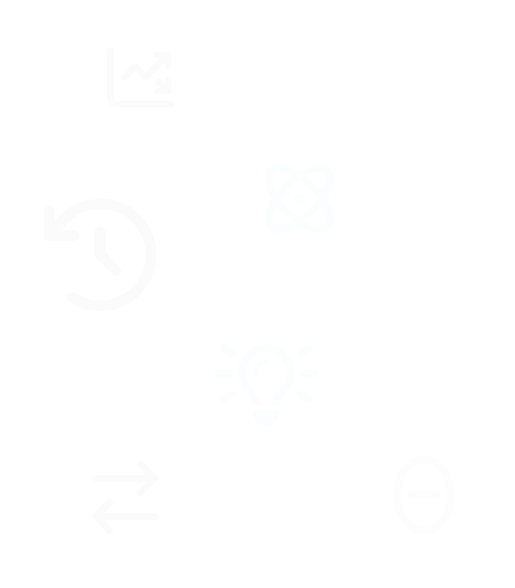
One common and effective approach traders use to analyze indicators is to compare them to recent history, most commonly the moving average. Most indicators tend to revert to their mean after a certain amount of time. Thus, different periods of moving averages are used - 3, 5, 10, 20, and 50 days.
Taking a look at slope, which is ORATS' measure of the steepness of the 30-day constant maturity IV skew, we can see the different moving averages available to use. If we want to find stocks that have an overvalued slope, we could look for stocks where the slope ratio to its 5-day moving average is above 1.
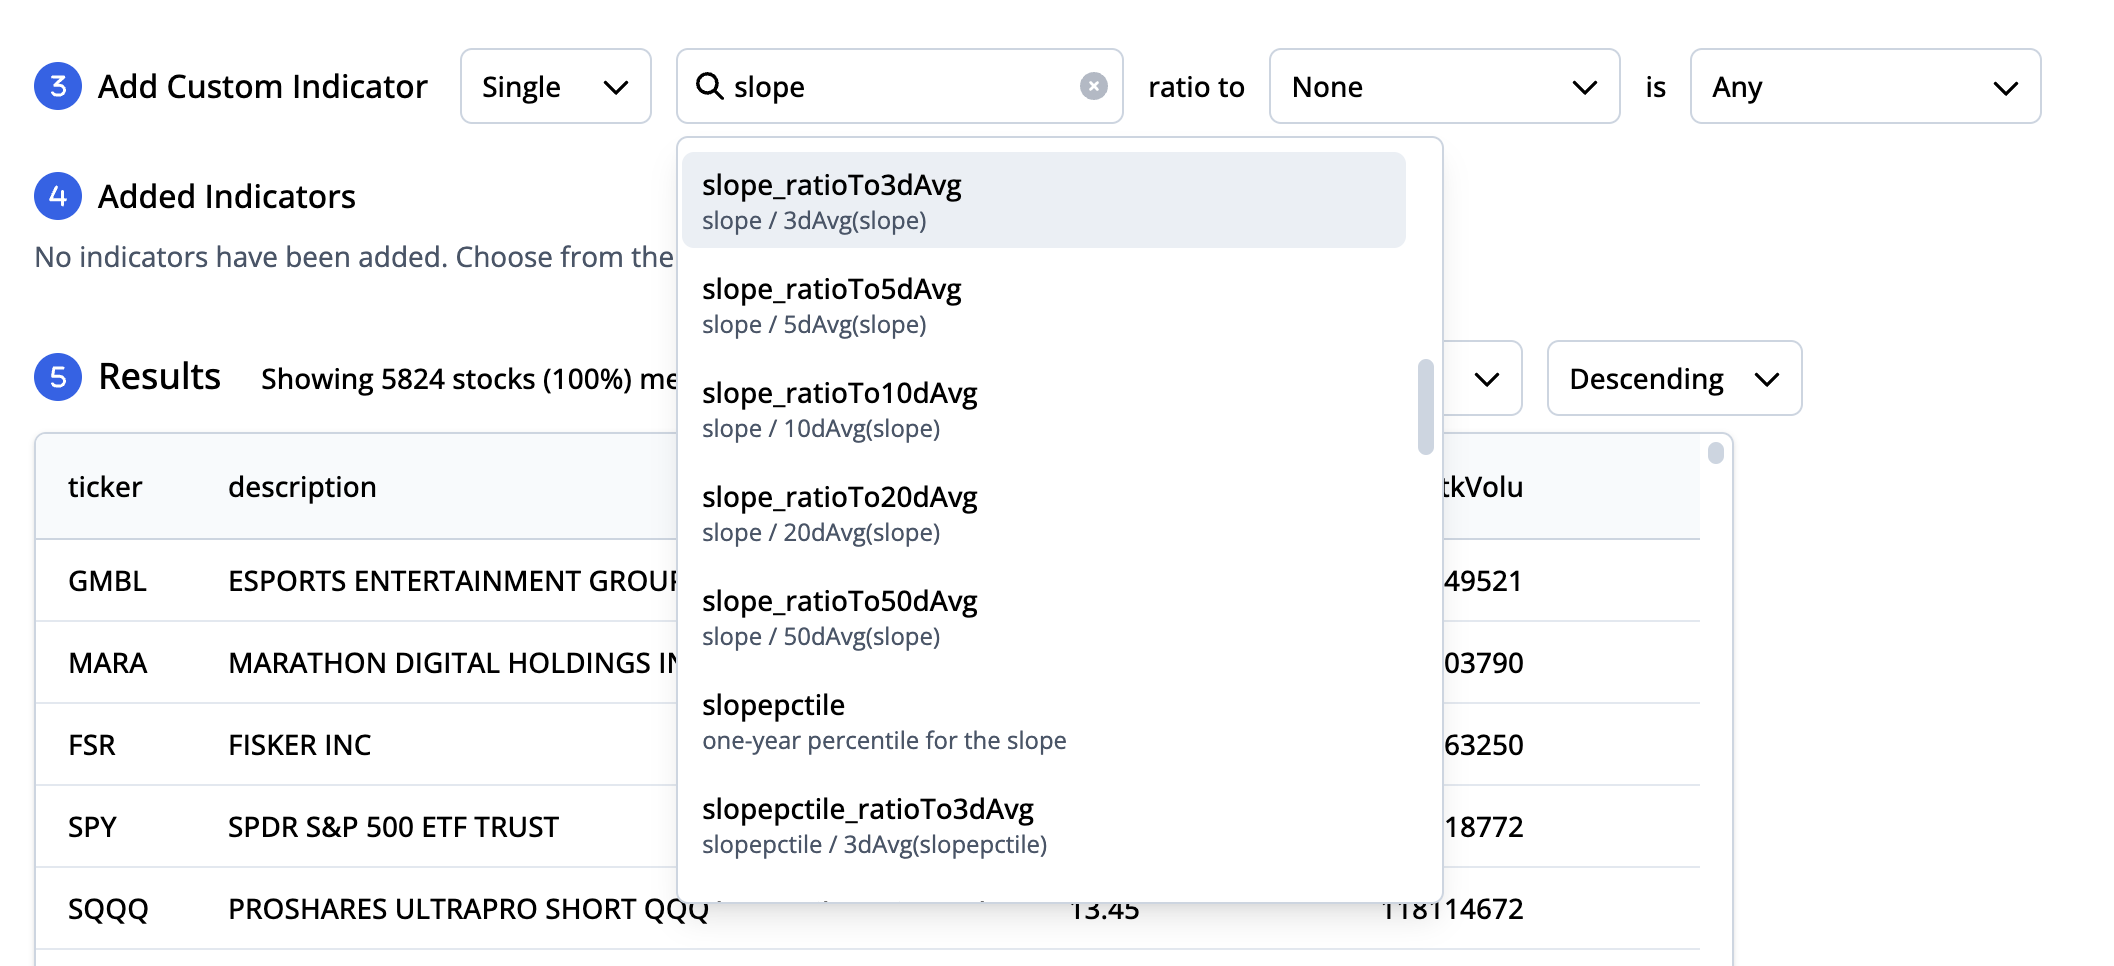
We can also see the history of an indicator from within the stock scanner. This helps confirm the results that we're seeing and analyze how that indicator changed over time.
Forecasts
We can also compare slope (and other indicators) to their forecast. We provide forecasts for certain summarizations of the volatility surface, including slope, deriv, ex-earnings IV, and the earnings effect. These forecasts are based on proprietary estimations of the future volatility surface using techniques discussed in prior lessons.
We can use these forecasts in the stock scanner to find stocks that meet certain criteria. For example, if the forecast of ex-earnings volatility is higher than the current value, that means ORATS projects volatility to increase. The resulting stocks could then be used to scan for options trades with high vega.
Related equities
Yet another use case of the stock scanner is the ability to compare indicators against related equities. When scanning for stocks, it can be helpful to analyze sectors and similar stocks. For example, wouldn't it be great if we knew the weighted average of all slopes in the tech sector? Fortunately, ORATS has that data in the form of "best ETFs". We keep track of over 30 of the most common SPDR sector ETFs – like XLK, XLY, and SPY – and calculate indicators like slope based on the weighted average of their components. The results are placed into a new symbol suffixed by "_C".
These symbols are perhaps the most unique and useful way to scan for stocks in ORATS. You can select "Best ETF_C" when building a custom ratio indicator to compare each symbol against its individual closest SPDR sector ETF. This powerful mechanism allows you to filter stocks that are under or overvalued relative to related equities.
Here is a full list of _C tickers: ALL_C, DIA_C, DJX_C, GDX_C, IBB_C, IGN_C, ITB_C, IWM_C, IYR_C, KBE_C, KRE_C, MDY_C, NDX_C, NQX_C, OIH_C, QQQ_C, RUT_C, SMH_C, SPX_C, SPY_C, XBI_C, XHB_C, XLB_C, XLC_C, XLE_C, XLF_C, XLI_C, XLK_C, XLP_C, XLRE_C, XLU_C, XLV_C, XLY_C, XOP_C, XSP_C
Fundamentals
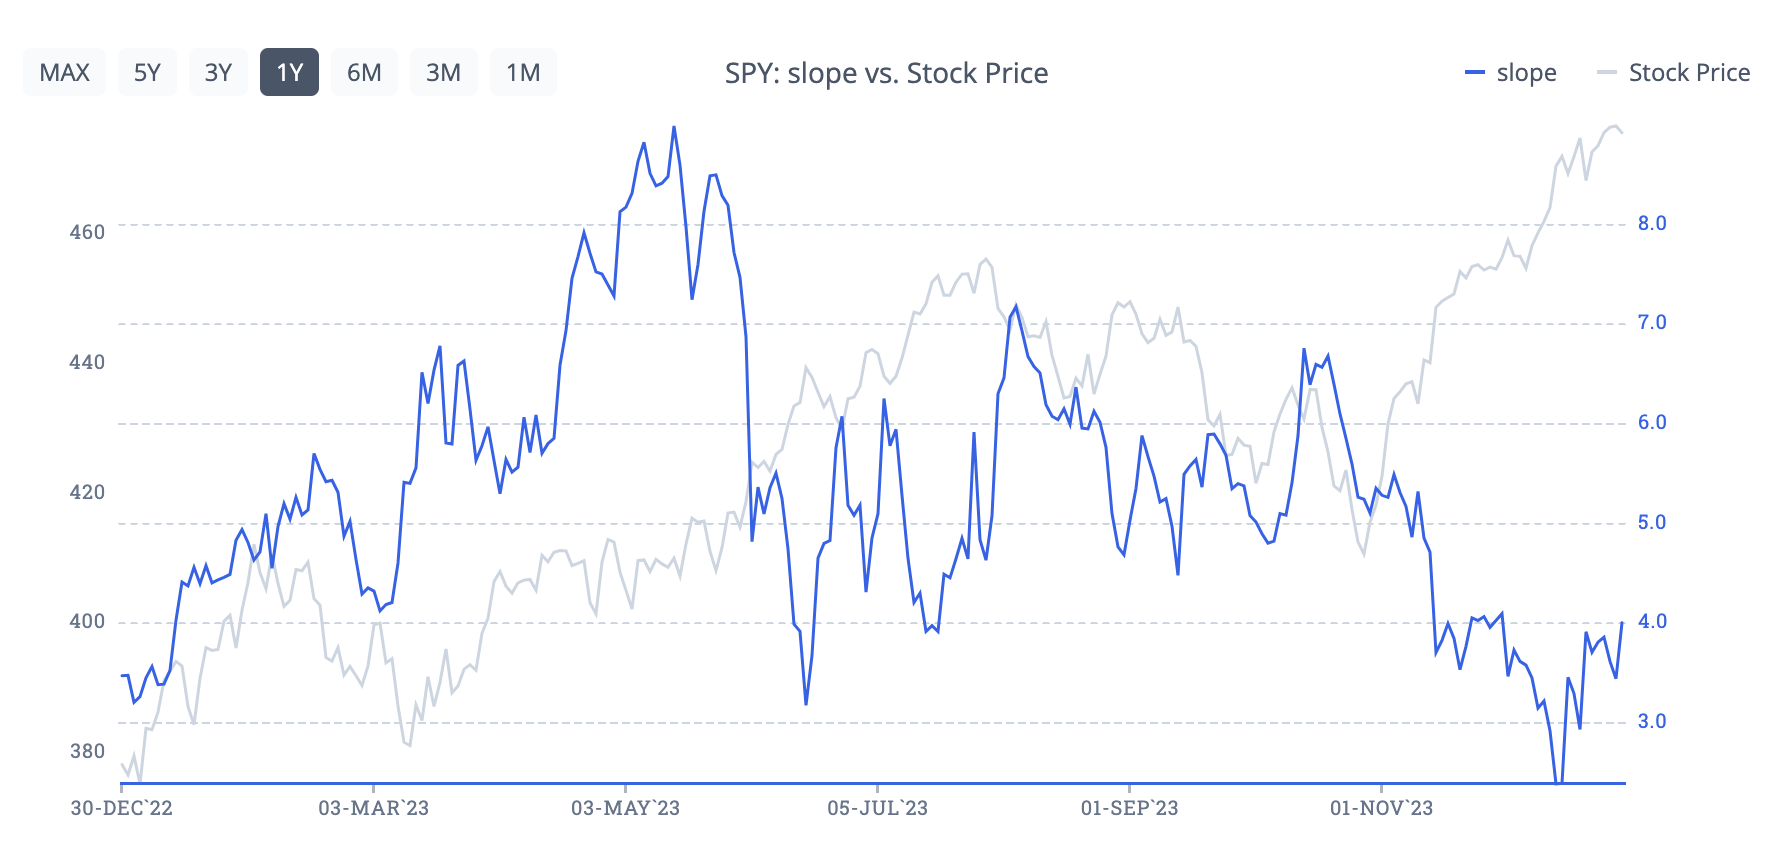
A great stock scanner wouldn't be complete without fundamentals. Fundamental indicators are different from the hundreds of technical indicators we calculate at ORATS. Fundamentals include price to earnings ratios, market cap, profit margin, and other balance sheet metrics. These can be helpful when narrowing down thousands of stocks to those that meet your economic and financial standards.
Scan templates
We've put together a series of stock scans that you can use to identify stocks meeting certain criteria. These scans are a great starting point in identifying stocks to trade certain strategies. Below are the descriptions for each scan as well as the option strategy that goes with it.
Unusual call volume
Informed traders often use calls to get leverage for bullishness on the stock. ORATS identifies these informed participants by comparing the average volume for the last 20 days for all strikes and calculating a ratio of that volume for today. The higher the ratio, the more calls that traded today versus the past 20 day average. ORATS also looks at how the implied volatility compares to its 3-day average. We only want scenarios where the IV is higher than the 3 day average to capture times when the informed traders are buying calls and probably bullish on the stocks. The filtered stocks would be candidates for bullish options strategies.
Unusual call volume scan template
Unusual put volume
Informed traders often use put to get leverage for bearishness on the stock. ORATS identifies these informed participants by comparing the average volume for the last 20 days for all strikes and calculating a ratio of that volume for today. The higher the ratio, the more puts that traded today versus the past 20 day average. ORATS also looks at how the implied volatility compares to its 3-day average. We only want scenarios where the IV is higher than the 3 day average to capture times when the informed traders are buying puts and therefore, probably bearish on the stocks. The filtered stocks would be candidates for bullish options strategies.
Unusual put volume scan template
Put-call skew cheap
This scan is looking for stocks that are moderately liquid where the low strike puts are typically undervalued and the high strike calls are overvalued. We call the relationship between low strikes and high strikes the skew or slope. One way we find if the slope is under or overvalued is to look at how the slope has changed recently. If the slope is lower than recent levels, the lower strike puts are cheaper and the higher strike calls are more expensive than usual. We also observe that slope percentile is low, and whether the slope forecast versus the current slope is high. All these indicators point to an undervalued skew. The filtered stocks would be candidates for a collar strategy.
Put-call skew cheap scan template
Put-call skew rich
This scan is looking for stocks that are moderately liquid where the low strike puts are typically overvalued and the high strike calls are undervalued. We call the relationship between low strikes and high strikes the skew or slope. One way we find if the slope is under or overvalued is to look at how the slope has changed recently. If the slope is higher than recent levels, lower strike puts are more expensive and the higher strike calls are cheaper than usual. We also observe that slope percentile is high, and whether the slope forecast versus the current slope is low. All these indicators point to an overvalued skew. The filtered stocks would be candidates for a risk reversal strategy.
Put-call skew rich scan template
Earnings this week
This simply scans for liquid stocks that are reporting earnings this week. Traders may want to protect or hedge their position or make a directional bet. The filtered stocks would be candidates for neutral strategies like straddles or an iron condor.
Earnings this week scan template
High IV30d
Sometimes, the implied volatility of a stock gets overvalued usually because of supply and demand imbalances in the options. We look at the ratio of the ex-earnings 30-day implied volatility versus its 5-day, 20-day, and 50-day average to identify these times. We also look at how the implied volatility of each stock compares to other stocks in its same sector. The filtered stocks would be candidates for short vertical spreads.
Low IV30d
Sometimes, the implied volatility of a stock gets undervalued usually because of supply and demand imbalances in the options. We look at the ratio of the ex-earnings 30-day implied volatility versus its 5-day, 20-day, and 50-day average to identify these times. We also look at how the implied volatility of each stock compares to other stocks in its same sector. The filtered stocks would be candidates for long straddles or strangles.
Hard-to-borrow
Hard-to-borrow stocks are identified by analyzing put-call parity discrepancies explained by options traders paying more for puts relative to calls. These stocks typically have higher implied volatility and may be poised for a short squeeze. The filtered stocks would be candidates for bullish strategies.