300 - Backtesting
Measuring performance
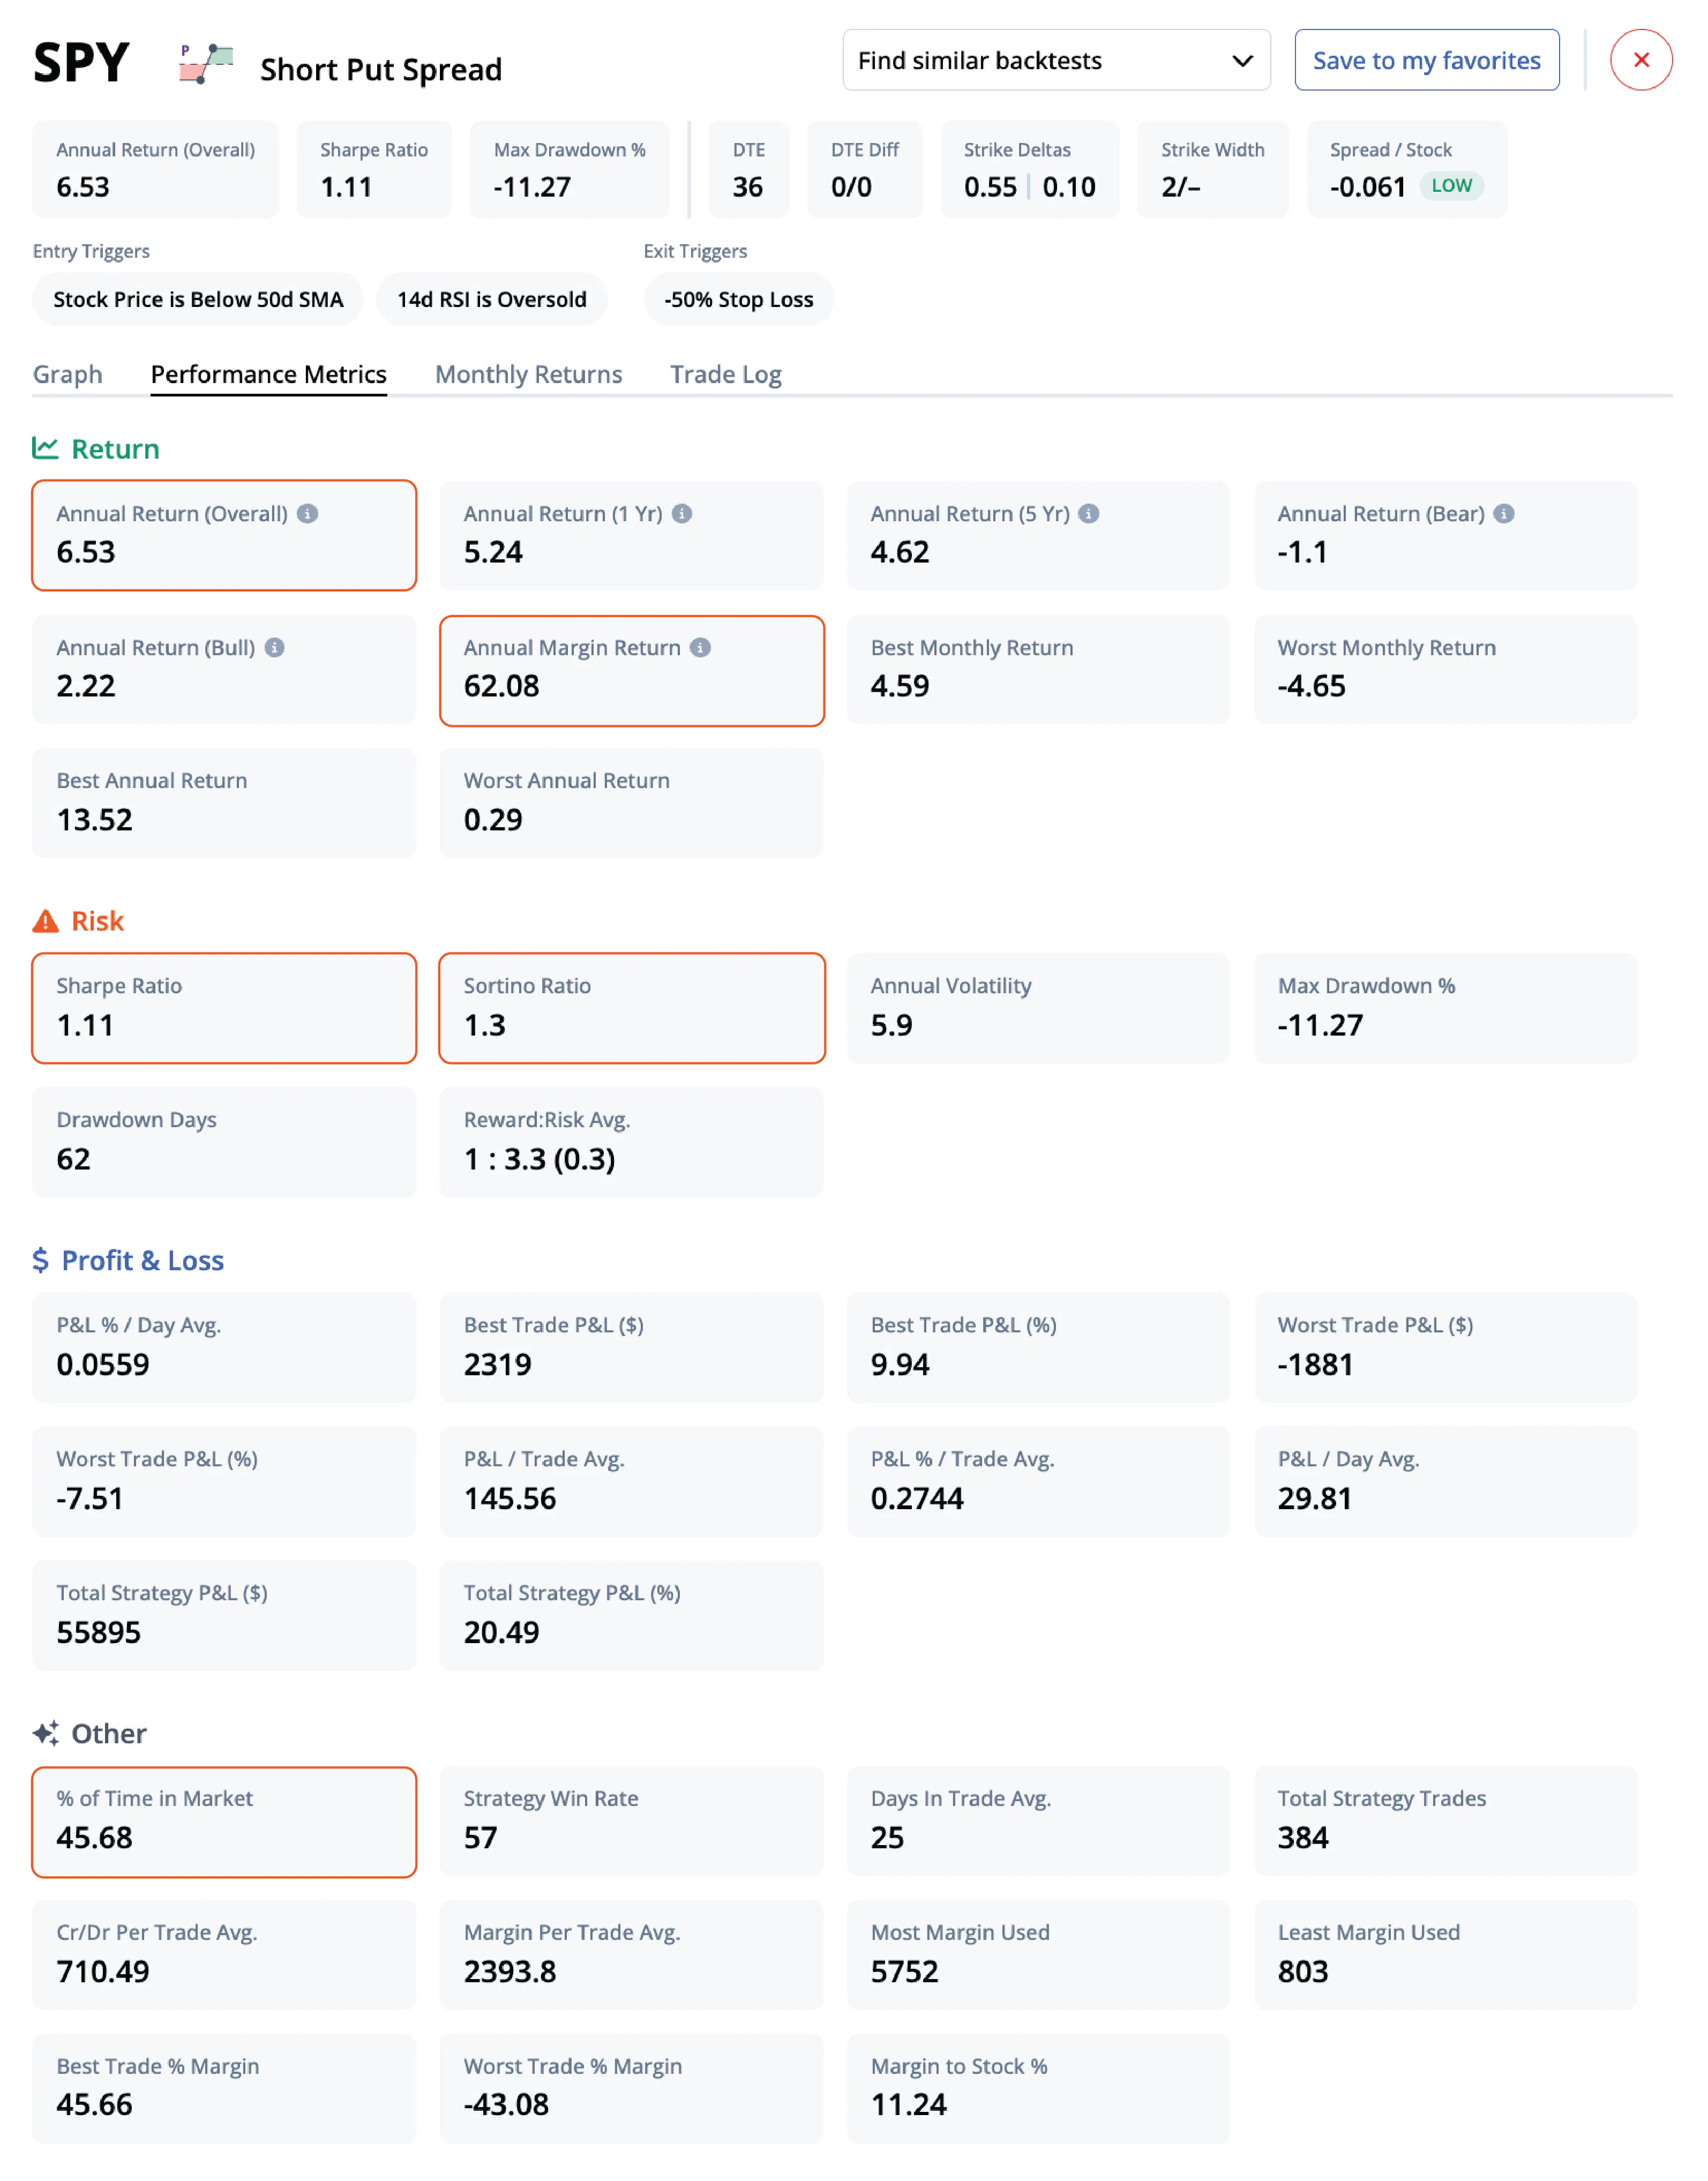
It’s important to measure the right performance metrics when backtesting, otherwise you’ll end up with a lot of data and no idea what to do with it. Before diving into the specifics, let's outline the four categories of performance metrics you'll see in the backtest finder: Return, Risk, Profit & Loss, and Others.
Performance metrics
Return: Metrics such as annual returns (overall, 1 year, 5 years, bearish and bullish markets), annual margin return, and best/worst monthly and annual returns.
Risk: Quantitative measurements such as Sharpe Ratio, Sortino Ratio, Annual Volatility, Max Drawdown %, Drawdown Days, and Reward to Risk Average.å
Profit & loss: Comprehensive data like average P&L % per day, best and worst trade P&L (both in dollar and percentage), average P&L per trade and per day, and total strategy P&L.
Others: Metrics including % of time in the market, strategy win rate, average days in trade, total strategy trades, credit/debit per trade average, margin per trade average, and margin to stock %.
Let's dive deeper into some critical metrics.
Notional vs. margin return
As mentioned earlier, it’s important to look at both notional and margin return because they are useful for different purposes. Notional return helps standardize performance when comparing across different symbols and strategies, while margin return helps you identify how efficiently your capital was used. Both are available in the performance metrics.
Sharpe vs. Sortino ratio
Our backtester also shows both Sharpe and Sortino ratios for each strategy. While they might seem similar at first, each ratio offers a distinct perspective on risk and should be understood separately.
The Sharpe ratio gauges how much excess return a strategy provides relative to the risk taken, using standard deviation as a proxy for risk. It's excellent for understanding a strategy's overall risk-adjusted return, but it falls short in one critical area – it doesn't distinguish between upside and downside volatility.
That's where the Sortino ratio comes in. The Sortino ratio, like the Sharpe ratio, evaluates risk-adjusted return, but it only considers downside volatility. In doing so, it addresses an important asymmetry in trading – traders generally welcome upside volatility while fearing its downside counterpart. A high Sortino ratio signals that a strategy minimizes damaging losses while potentially capitalizing on desirable volatility. By providing both these ratios, our backtester allows traders to examine a strategy's return through multiple risk perspectives.
Filtering percent of time in market
Filtering by the percent of time in market is an important feature of our backtester, mainly to reduce overfitting. By setting a minimum filter, you can focus on backtests with a statistically sound number of market days.
Imagine two strategies: Strategy A has been in the market for 300 days, and Strategy B for only 30 days. While Strategy B might show an impressive return for its short time, its performance metrics might be unreliable due to the small sample size. Our tool allows you to filter out such strategies, preventing overfitting and enabling a more robust evaluation of the strategies' true performance. Like percent of time in market, you can apply filters to other metrics such as drawdown days, total strategy trades, and margin to stock % to fine-tune your risk tolerance and trading preferences.
Profit and loss metrics
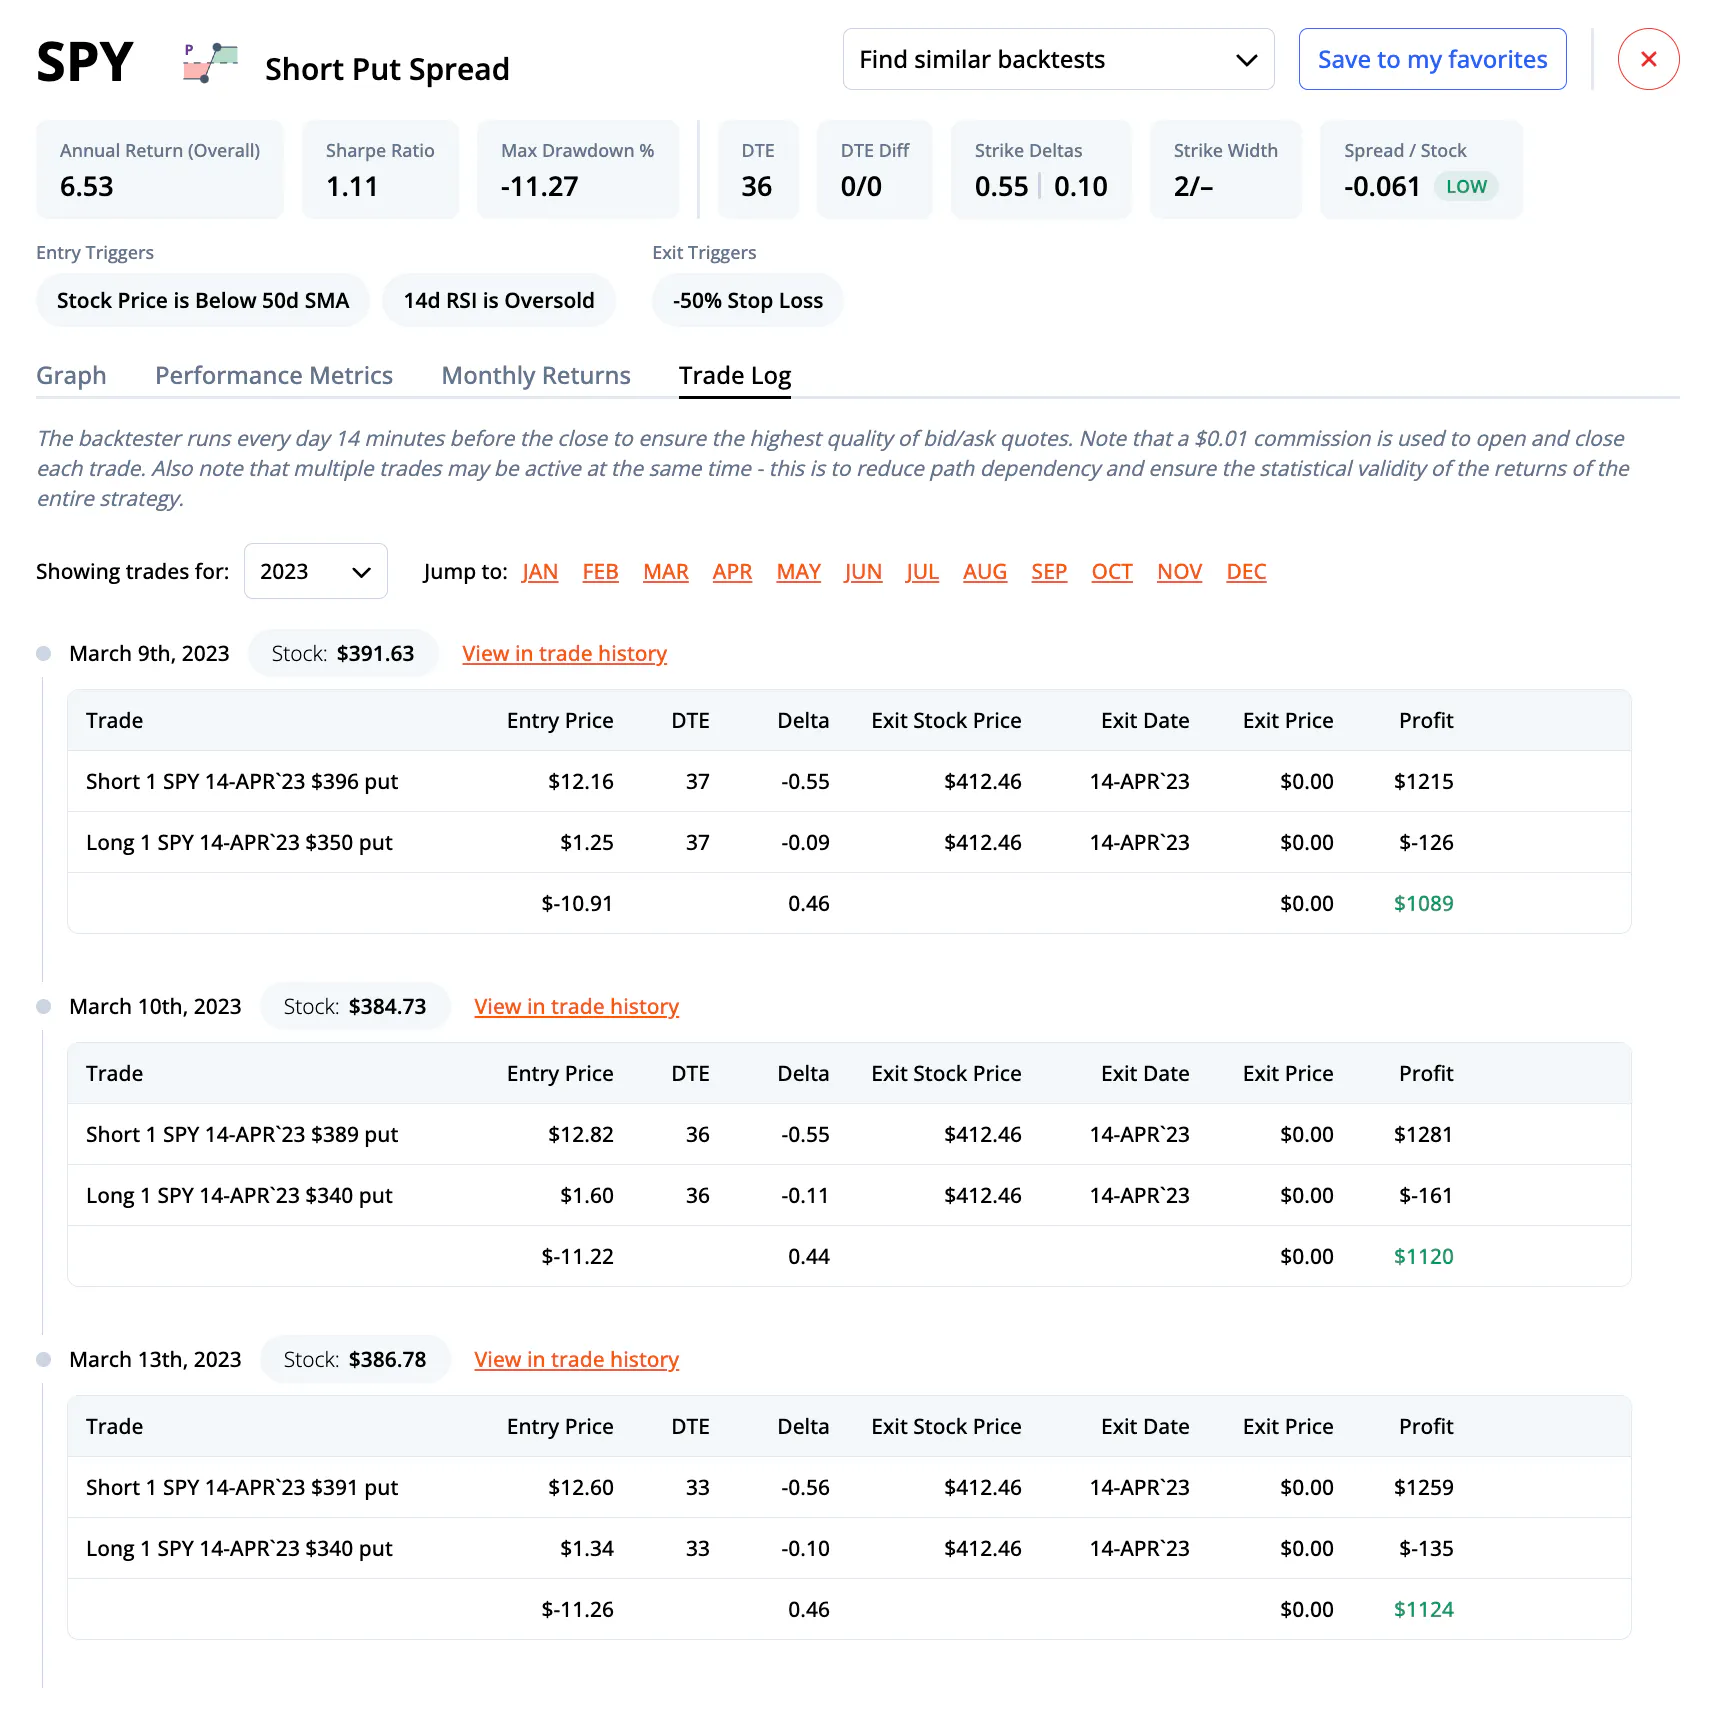
We calculate various measures of profit and loss to provide a comprehensive view of a strategy's performance. The best and worst trade p&l metrics make it easy to quantify your upside potential versus the downside risk of the strategy. Sometimes it’s good to filter the table based on p&l percent per day, as that can be a good baseline for an effective strategy.
Below you can see the trade log for a short put strategy on SPY. The trades are ordered chronologically depending on when they were entered. The total profit is shown on the right, with a breakdown of the entry price and exit price included. You can see how the total dollar profit for each trade is calculated, assuming $0.01 slippage on both the entry and exit. This value is used in many of the calculations related to profit and loss.
Ranking algorithms
At this point, we’ve covered most of the concepts, tools, and techniques in the backtest finder. To recap, we first examined some of the common pitfalls traders face when doing their own backtest, which inspired us to create the new backtest finder. With over 50 million backtests and counting, filtering these backtests to meet your investment criteria is critical, which is why we paid close attention to the entry and exit criteria along with the 37 different performance metrics.
Finally, let’s look at the three unique ranking algorithms that bring it all together—Best overall performance, Best conservative winner, and Best return on risk or individual sorts on P&L average daily profit, Sharp, Sortino and the like. Whether you're searching for a consistent winner, a risk-adjusted return champion, or an all-rounder, our ranking algorithms can cater to your unique preferences, offering a targeted understanding of each strategy's potential effectiveness. Here’s a breakdown of each of the custom ranking algorithms:
Best overall performance: This ranking looks at the following metrics and applies the following weights: Annual Return (Overall) (33.3%), P&L % Per Day Avg. (16.6%), Sharpe Ratio (33.3%), and Sortino Ratio (16.6%).
Best conservative winner: This ranking looks at the following metrics and applies the following weights: Annual Return (Overall) (18.2%), Max Drawdown % (9%), Strategy Win Rate (9%), P&L % Per Day Avg. (18.2%), Worst Annual Return (9%), Worst Monthly Return (9%), Sharpe Ratio (9%), and Annual Sortino (18.2%).
Best return on risk: This ranking calculates the following metric: P&L % Per Day Avg. / (-1 * Average (Worst Monthly Return, Worst Annual Return, Max Drawdown %))
To find the strategy that meets your investment objectives, sort the table of backtests by any performance column instead of a ranking algorithm and filter the results based on your needs.
The future of backtesting
We believe in the power of backtesting and the weight it carries on executing an effective systematic trading strategy. Rule-based strategies grounded in historical data are a pillar of successful trading, which is why we’ve developed our new backtesting toolkit to help you quickly find your favorite strategies.
Moving forward, we’ll continue to add more symbols to our database so that you can find backtests for every ticker you trade. We’ll also continue to add more niche strategies, such as the recently added Wheel - a popular premium-generating strategy.
Our mission is to go from backtest to implementation in one click. We want finding your favorite strategy to be intuitive and simple, and then for you to systematically trade it with one click of a button. We’re partnering with various brokers to help bring this vision to life. If you’d like to test out the latest features, please email us at support@orats.com.