300 - Backtesting
Custom backtesting
In the last several lessons, we walked through how you can find your favorite top performing strategies in the backtest finder. While this covers most scenarios, you might want to run your own custom backtest using specific entry and exit criteria. In this lesson, we'll look at the two available options for you in ORATS' suite of web tools.
New custom backtester
Benefits
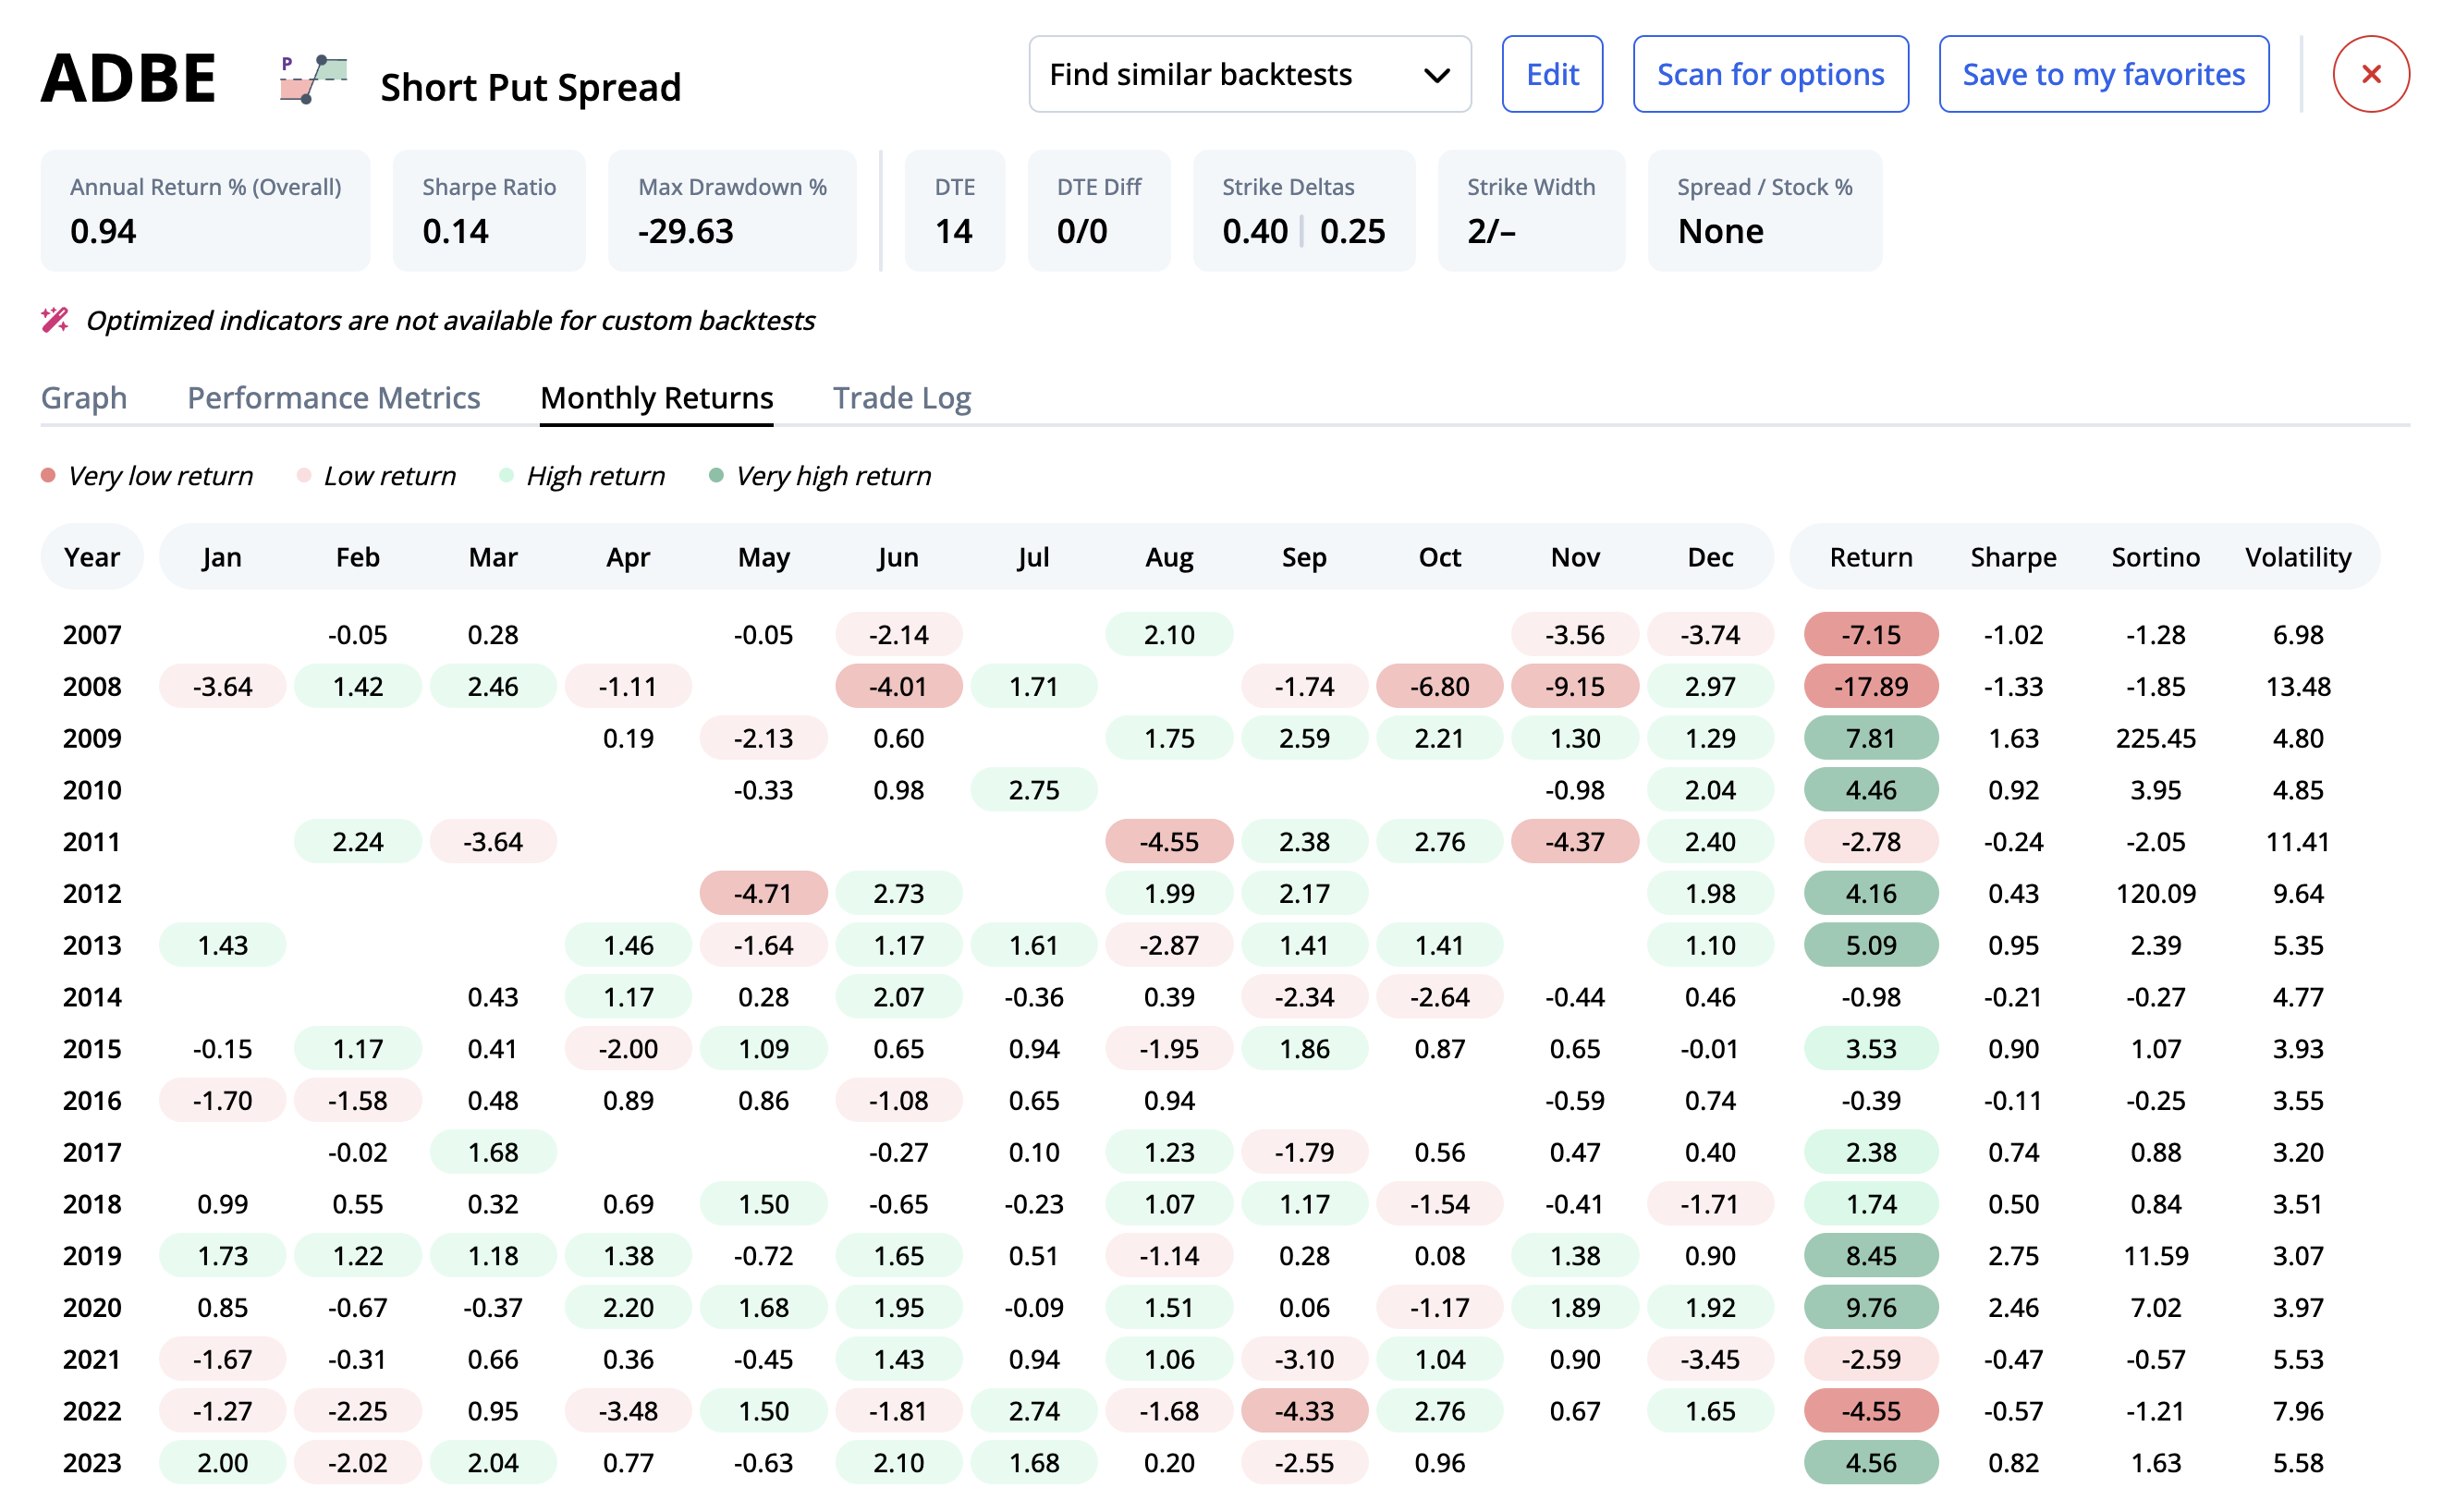
The new custom backtester is our latest offering that we've designed alongside the backtest finder. The backtest details popup presents information in the same style as the backtest finder, with a graph of performance, monthly returns, performance metrics, and a trade log. Additionally, the "find backtests" button is available to help reduce overfitting. Once you're satisfied with the backtest, you can click the "scan for options" button to quickly send your entry parameters to the option scanner to help find a trade.
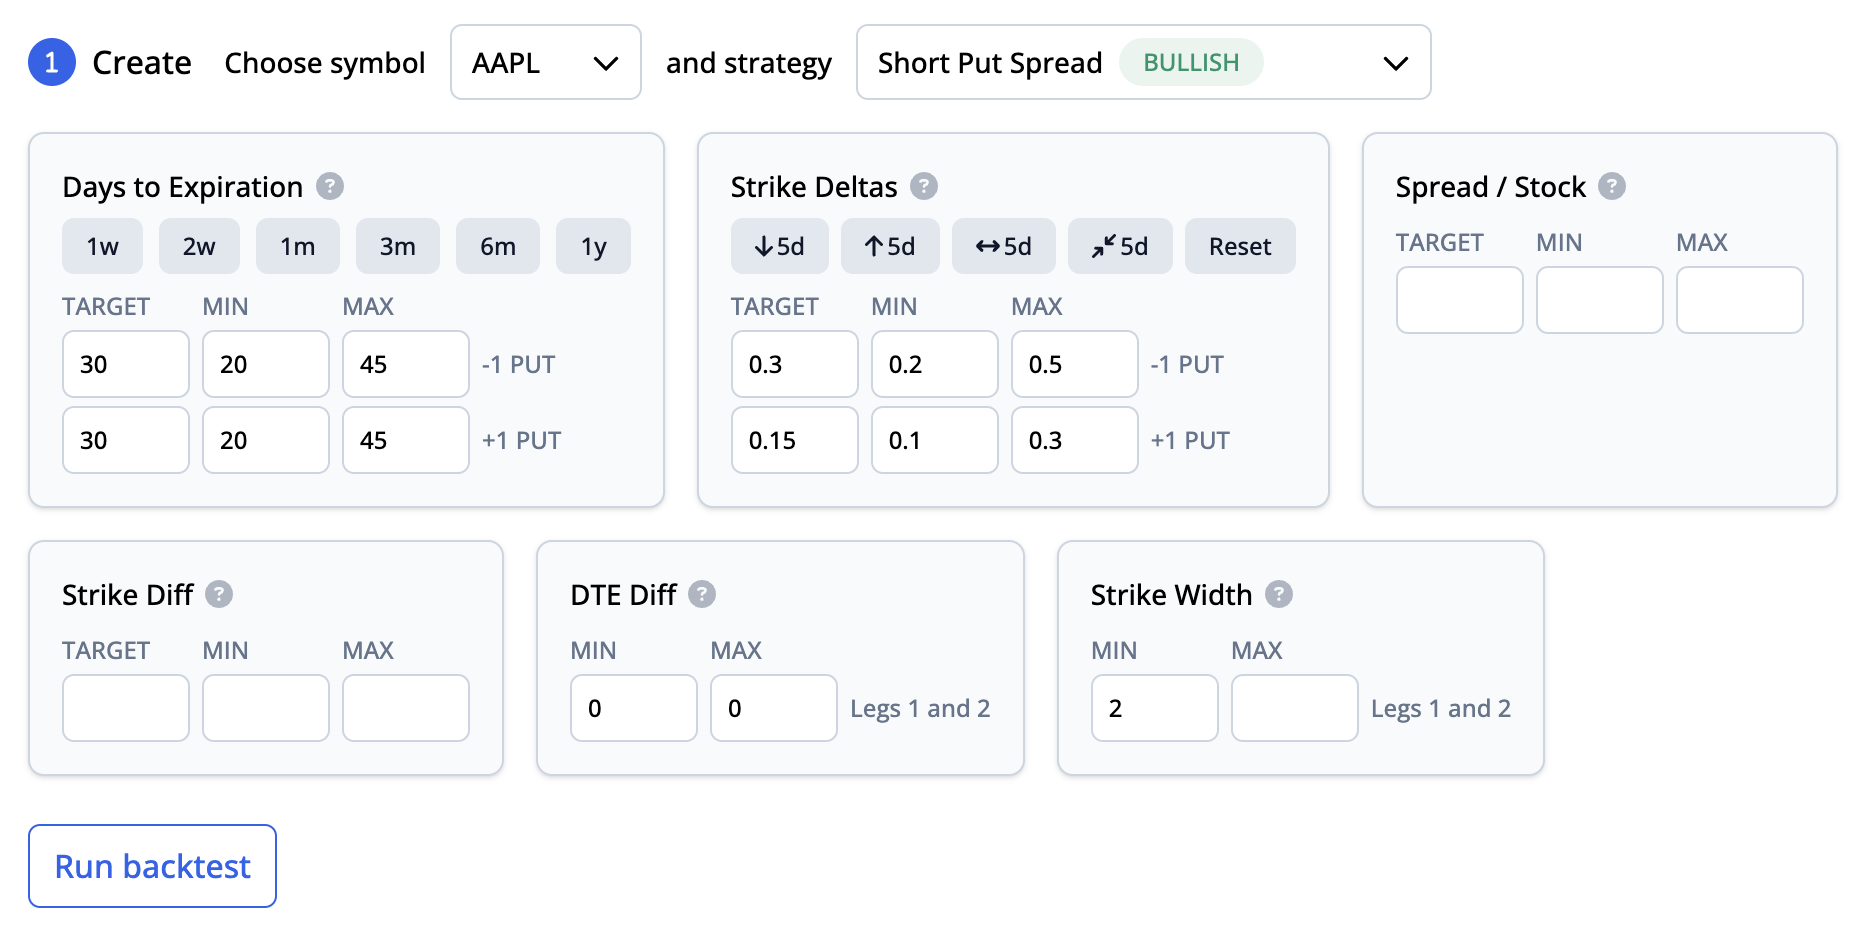
It's also easier and faster to design your backtest, with all of the entry criteria bundled into a concise and intuitive interface.
Finally, all of your backtests are presented in a table with several helpful columns, including annual return, max drawdown, % of time in market, among others.
Drawbacks
Since we are developing the new custom backtester in tandem with the backtest finder, we are currently only offering the same symbols in both. That means the custom backtester is currently limited to around 50 symbols and 10 strategies while we continue to grow these tools.
We are working to reach feature parity with the legacy custom backtester, which you can read more about below. As such, the new custom backtester only includes a subset of the entry and exit criteria available in the legacy version.
Legacy custom backtester
Our legacy custom backtester was our flagship product from 2019 to 2022 until we launched the dashboard. The legacy version includes all of the most advanced, niche features that you would need to develop a highly sophisticated backtest. You can access the legacy custom backtester here.
Symbol(s) and strategy
You can choose to test either a single symbol or upload a CSV file where you can specify multiple weighted symbols as well as custom entry and exit signals.
We offer 17 different pre-canned bullish strategies, 13 bearish, and 14 neutral. Some of these strategies, like covered calls and collars, include long stock to help you backtest both stocks and options together.
Entry criteria
The legacy custom backtester stands out with its massive selection of entry and exit criteria. In the entry criteria alone, there are over 15 different parameters you can set:
Date range: The beginning and ending of the test. From 2007-01-03 to present.
Expiration type: Choose all, weekly, or monthly.
Stock position: Choose type (none, overlay, or married) and ratio. Ratio of 1 is long stock and ratio of -1 is short stock. The difference between overlay and married type is: Overlay you hold the stock from start to finish throughout the backtesting period. Married you hold the stock and exit the stock when you exit the option or when the option expires.
Return type: Choose per trade (notional or margin) and daily (average or compound) returns. Set per trade to notional to calculate returns using notional and margin to calculate returns using margin. Set daily to average to calculate annual returns as an average. Set daily to compound to calculate annual returns using compounding.
Entry days: Stagger trades every this many entry days. For example, there would be a new trade every 7 days from the last new trade. To reduce path dependency, set this to 1 to make a new trade potentially every day.
Spread yield %: Spread yield allows you to filter based on the option trade price relative to the stock price. Calculated as (option entry price / stockprice). For example it would search options that have spread yield between and including 0.05 to 0.10 (5 and 10 percent). For credits, i.e selling options strategies, make sure the spread yield inputs are negative.
Spread price: Spread price allows you to filter by the total price of the spread. For example, a target of 0.15 ($) and min max of 0.10 to 0.20 will select a trade closest to 0.15 but only if the spread price is within the min max range. For credits, i.e selling options strategies, make sure the spread prices are negative. For example, with a short put, target: -0.5, min: -1 max: 0.
Spread delta: Spread delta allows you to filter by the net delta of the spread. Calculated as leg1ratio _ leg1delta + leg2ratio _ leg2delta. For example, it would set a min max of .30 to .40 and find only spreads with net deltas within that range. Be careful, you might have to use negative deltas when you set min and max.
Strike diff %: Enter the trade when the trade price divided by the difference in strike prices is between the min and max. For example, a $5 wide call spread would enter if the price of $1 divided by 5 is between the min of .10 and the price of 4.5 that is above the max of .90. For credits, i.e selling options strategies, make sure the strike diff % inputs are negative.
Hedge days: Delta hedge at the end of this many days. For example, 1 would delta hedge at the end of each day.
Hedge tolerance: Hedge if the delta is below min or above max. For example if you set max: 0.1 for hedge tolerance, it would hedge the delta if delta is greater than 0.1 delta.
Market width ratio: Market width ratio is equal to (optionAsk - optionBid) / strike. So to filter out any option strikes that have 5% of market width relative to the strike, we would set the max to 0.05.
AbsCpDiffStkPxRatioMax: Absolute call put parity difference stock price ratio maximum is the absolute value of the put call parity formula inequality divided by the stock price. The max value is the maximum this value can be and still accept a trade for a backtest. This is useful parameter to avoid obviously bad markets. A typical amount for this would be a max of 0.02.
Implied bid volatility: Implied bid volatility found by using the bid price of the option. For example, it would search options with implied bid volatilty between and including 15 to 80.
Implied ask volatility: Implied ask volatility found by using the ask price of the option. For example, it would search options with implied ask volatilty between and including 15 to 80.
Option bid: The bid price of the option. Use the min max to set a minimum and maximum options bid price to trade in the backtest. For example, search options with a bid price between and including min 0.05 to max 0.25.
Option ask: The ask price of the option. Use the min max to set a minimum and maximum options ask price to trade in the backtest. For example, search options with a ask price between and including min 0.05 to max 0.25.
Entry date triggers: The entry date trigger is the number of days before or after the event you will enter the position. Choose between earnings or conferences/events.
Entry indicator triggers: Set as many of these as you would like. You can select from hundreds of our proprietary indicators, and even make your own using ratios. We also offer a variety of technical indicators - MACD, RSI, SMA, etc. You can choose to measure the indicator on the symbol you are testing, or a symbol of your choice. The trade will enter if the reading for the day is between the min and the max.
Exit criteria
In addition to the plethora of entry criteria, the legacy custom backtester offers similar criteria for exiting:
Exit spread delta: Exit and roll the trade if the spread total delta exceeds the min or max value. Calculated as leg1ratio * leg1delta + leg2ratio * leg2delta. Can be absolute delta or stock OTM %.
Exit DTE days: Exit the trade when the days to expiration left is equal to or below this. For example, it would exit a trade with 10 days left to expiration. To hold a trade until expiration, enter "expire".
Exit profit/loss %: Set stop losses and profit targets. For example, to set a stop loss of -0.5 (-50%) and a profit target at 2.0 (200%) for a long call, you would set the min to -0.5 and max to 2.0. Set only a stop loss by leaving the max blank.
Exit leg on strike trigger: You can exit a trade based on the delta and/or OTM% levels of any one of the legs. For OTM%, you would exit the trade when the strike as a percent of stock price of a leg is below the min or above the max. For example, it would exit when the strike percentage of stock price is below 1.05 or above 1.20. Add a leg by clicking the "+" button.
Exit strike diff %: Exit the trade when the trade price divided by the difference in strike prices falls below the min or rises above the max. For example, a $5 wide call spread would enter if the price of $1 divided by 5 is between the min of .10 and the price of 4.5 that is above the max of .90. For credits, i.e selling options strategies, make sure the strike diff % inputs are negative.
Exit hold days: Exit the trade when the trade was held this many days. For example, it would exit a trade when the trade has been held for 20 days.
Exit spread price: Exit the trade when the trade price falls below the min or rises above the max. For example, it would exit if below 0.4 ($) min or above 0.90 max price. For credits, i.e selling options strategies, make sure the spread prices are negative. For example, with a short put, target: -0.5, min: -1 max: 0.
Exit date triggers: The exit date trigger is the number of days before or after the event you will enter the position. Choose between earnings or conferences/events.
Exit indicator triggers: Set as many of these as you would like. You can select from hundreds of our proprietary indicators, and even make your own using ratios. We also offer a variety of technical indicators - MACD, RSI, SMA, etc. You can choose to measure the indicator on the symbol you are testing, or a symbol of your choice. The trade will exit if the reading for the day is below the min or above the max.
Leg relationships
Leg relationships are a special type of entry criteria that allows you to control the relative DTE, delta, or strike width between each of the legs. These are commonly used when backtesting calendars or other multi-leg spreads where it's critical for the legs to be related to each other.
Each of the following leg relationships offers three separate criteria: L1L2, L2L3, and L3L4. These represent the legs in the equation. For example, L1L2 represents the second leg's value subtracted from the first leg's value (leg 1 - leg 2). The trade would only enter if the value of this equation is above the min and below the max.
DTE diff: L1 days to expiration minus L2 days to expiration.
Delta total: L1 delta minus L2 delta.
Strike width: L1 strike width minus L2 strike width.
Strike width %: L1 strike minus L2 strike divided by the stock price.
How it works
Our custom backtesting engine is quite complex, but here we've simplified it down to eight general steps, along with slippage and commission assumptions.
The Backtester scans for entry from the start date using all the user input entry parameters.
Once an option trade is found, the Backtester calculates the option returns for each day. If there are hedging or married stock position in the strategy, we calculate that for each day at the time of option returns calculation.
For each day, the Backtester checks for exits using all the user input exit parameters.
If any of the exit parameter is triggered, the Backtester exits the option position.
When an option exits, the Backtester scans for entry again and step 1 is started over again until the end date or the latest available date in our database.
If there are overlay stock component in the strategy, the stock daily returns are added to the option daily returns.
If there are any weightings we calculate the weighted returns last when the backtest statistics are calculated.
Adjustments are handled similar to exits but we use adjustment entry and exit triggers to enter and exit adjustment trades.
Slippage
Slippage is the extra amount paid or the smaller amount received for an option bought or sold compared to the middle of the options bid-ask. We use a percentage of the options bid-ask spread to represent this amount and the percent slippage is different depending on how many legs there are in the trade.
The slippage formula to buy is: Bid + (Ask - Bid) * slippage%
The slippage formula to sell is: Ask - (Ask - Bid) * slippage%
The following table explains the default method to calculate slippage on entering and exiting a trade:
| # of Legs | Slippage % | bid x ask | Buy Trade Price | Sell Trade Price |
|---|---|---|---|---|
| 1 | .75 | 1.20 x 1.40 | 1.35 = 1.20 + (1.40-1.20) * .75 | 1.25 = 1.40 - (1.40-1.20) * .75 |
| 2 | .66 | 5.10 x 5.90 | 5.628 = 5.10 + (5.90-5.10) * .66 | 5.372 = 5.90 - (5.90-5.10) * .66 |
| 3 | .56 | 4.20 x 5.20 | 4.76 = 4.20 + (5.20-4.20) * .56 | 4.64 = 5.20 - (5.20-4.20) * .56 |
| 4 | .53 | 8.50 x 10.30 | 9.454 = 8.50 + (10.30-8.50) * .53 | 9.346 = 10.30 - (10.30-8.50) * .53 |
According to the table above: for a 1 leg option trade like buying a call, the default slippage is 75% of the bid ask width; for a 2 leg trade like a put spread vertical the slippage would be 66% of the total bid-ask spreads; for a 3 leg trade like a butterfly, slippage would be 56% of the bid-ask width for all legs; and finally a 4 leg iron condor would have a slippage of 53%.
Commission
We use $1.00 per option contract and $0.01 per share of stock when calculating returns. If the option exits out of the money at expiration with $0 value, we only deduct $1.00 for entry. If the option exits in the money at expiration with value, we will deduct two ways on entry and exit. If the option exits early, we deduct two ways on entry and on exit. Same goes with stock returns.
Calculating daily returns
We calculate our daily returns using notional returns. The change in daily values of the option is divided by the notional or stock price at entry of the trade. We will sometimes show margin returns depending on the tool, but in general we like to use notional because of the reasons explained here.
The best way to explain notional return it is to use an example below:
Let's say we entered a XYZ Long Call at $1.20 on 1/3/2007 with a stock price of $100. On 1/4/2007, our option hit $1.80. Our notional daily return calculation would be: ($1.80-$1.20)/$100 = .006 which is .6% daily return on 1/4/2007. Then on 1/5/2007 our option went down to $0.90. Then our daily notional return would be (.90-1.80) / $100 = -.009 on 1/5/2007.
The formula for daily return = option profit / opening stock price.
If there are any stock components (Hedging, covered calls, married puts, etc.) we use the formula: (option profit + stock profit) / opening stock price.
Calculating annual returns
We use average returns instead of compound returns since compounding returns create special problems in option trading. To calculate the annual returns for each year, just add up the daily returns for the date range of the year. So if you want to calculate 2007 annual returns, just add up the daily returns from 1/1/2007 to 12/31/2007.
To calculate the total annual returns from all the years, simply add all the daily returns then divided by how many years there are. So for example, let’s say the total return is 32% and the backtest date range is from 1/3/2007 to 10/31/2018. Then you divide 32 from (11 yrs + (10/12)) = 11.83 years. Our backtest annual return would be 32/11.83 = 2.7%.
Next steps
After you've done a thorough amount of research and analysis, it's time for the second pillar of successful options trading - implementation.
When implementing a systematic strategy, it's critical to have quality scans and signals to accompany a backtest. In the next few lessons, we'll look at the stock scanner, option scanner, signal builder, and trade ideas tabs to explore how we can utilize proprietary theoretical values and hundreds of indicators to find good trades.