400 - Scanning and execution
Option scanning
In the previous lesson, we reviewed how to scan over 5,000 stocks to help narrow down the symbols you want to trade. Now that you have a stock (or list of stocks), it's time to examine their options chains and find a trade that meets your investment objectives.
Custom strategies
Whether you're coming from a backtest, stock scan, or you just have a stock that you're interested in, a great option scanner should be able to handle any strategy. There are over 25 different commonly known strategies, ranging from one to four legs, and either bullish, bearish, or neutral. In recent years, advanced traders have been exploring more custom strategies, which involve varying the ratios and sides of the calls and puts from the common strategies.
For example, in this video we reviewed a custom call collar strategy that takes a short risk reversal and adds a long call to limit the upside risk of the strategy.
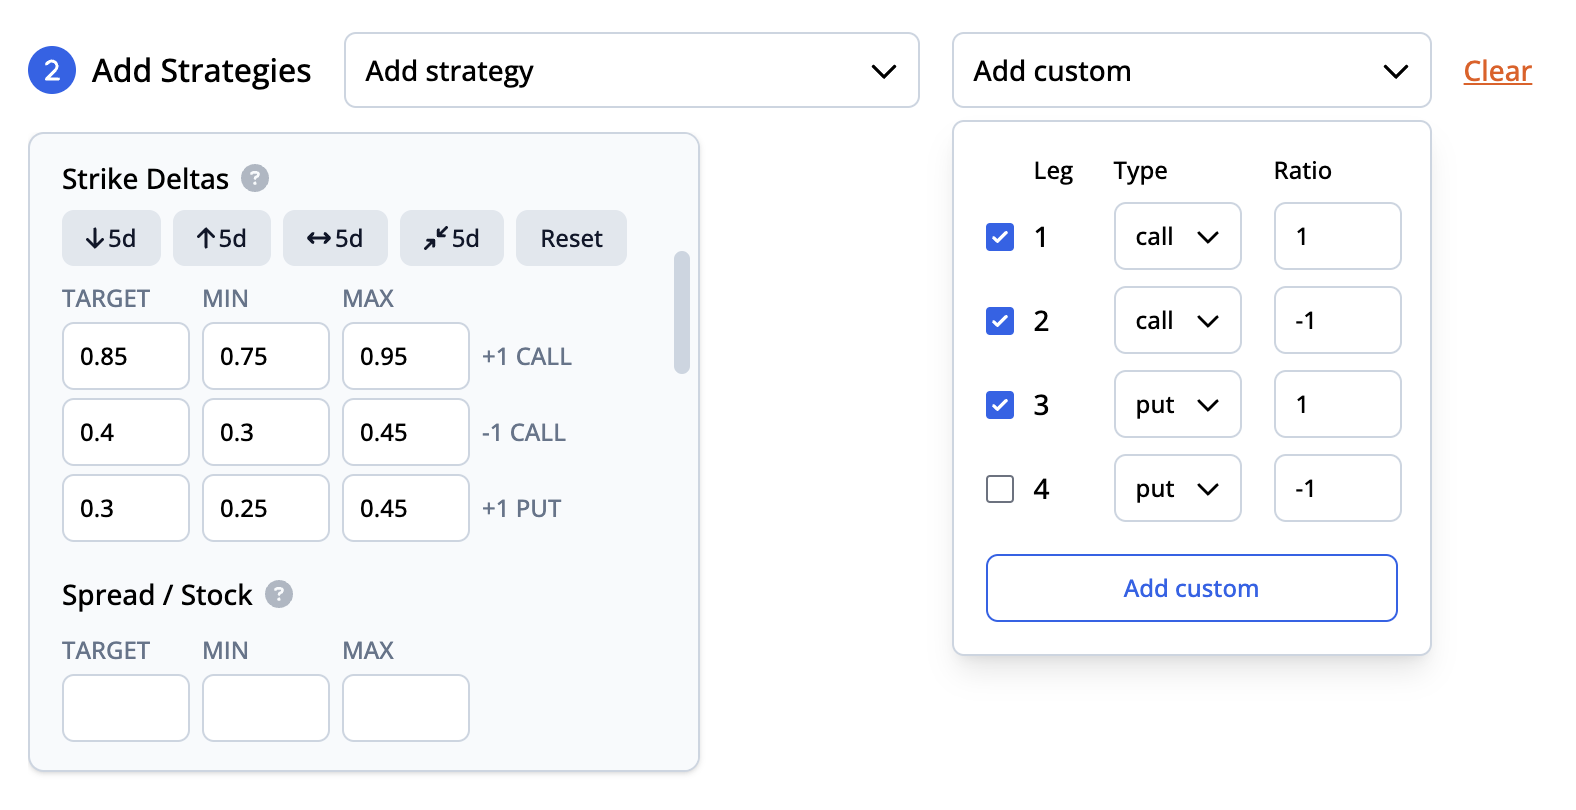
Custom strategies are just one of many ways to use the ORATS option scanner to find your favorite trade.
Theoretical values
After running an option scan in ORATS, you're presented with a list of trades that match your critiera. In addition to the common filters - expiration date, price, strike deltas, implied volatility, etc. – we've enhanced the scanning experience by including three theoretical edges, each meticulously calculated to help give you more insight into the true value of the price. Positive edges indicate that the market price of the trade is undervalued, while negative edges indicate the opposite.
Distribution edge
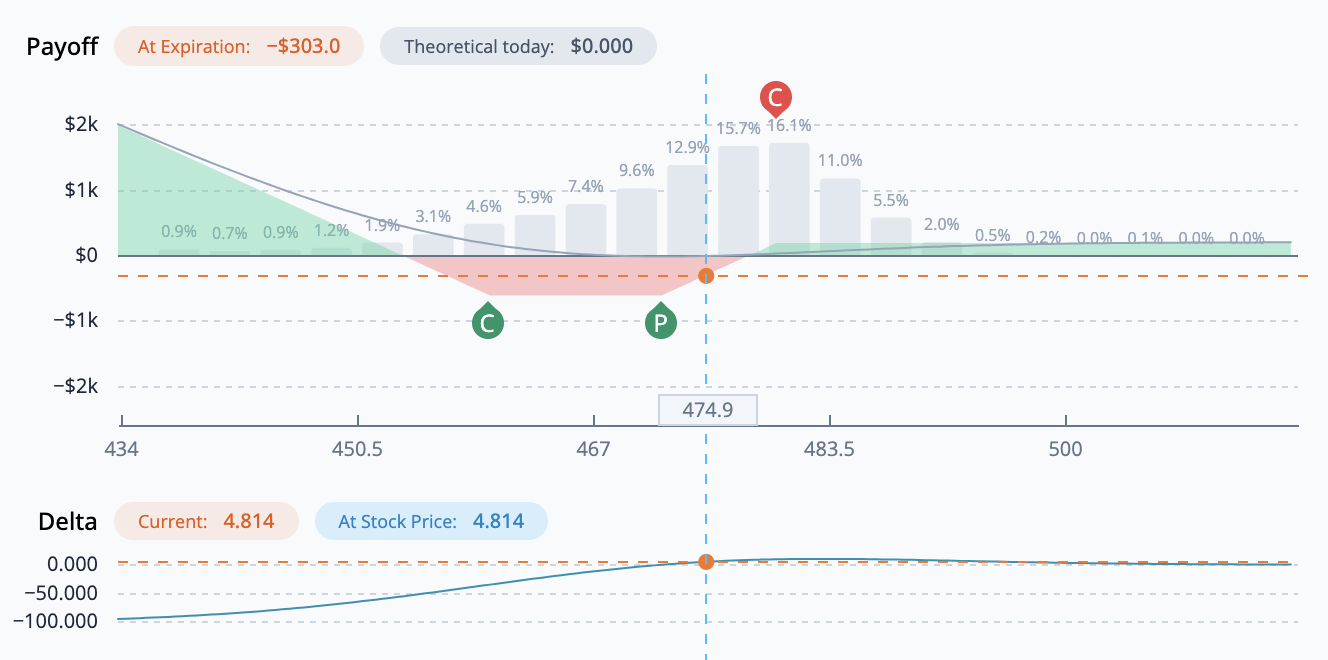
Our first theoretical edge (D%) focuses on the distribution of past stock returns over the same period of time as the trade’s days to expiration. Basically, we’re using 15+ years of historical data to calculate the likelihood of the stock price ending up at a series of different prices on expiration day. Specifically, we calculate the probability for 21 different price observations, or buckets. These buckets are denoted by the grey bars in the payoff diagram below:
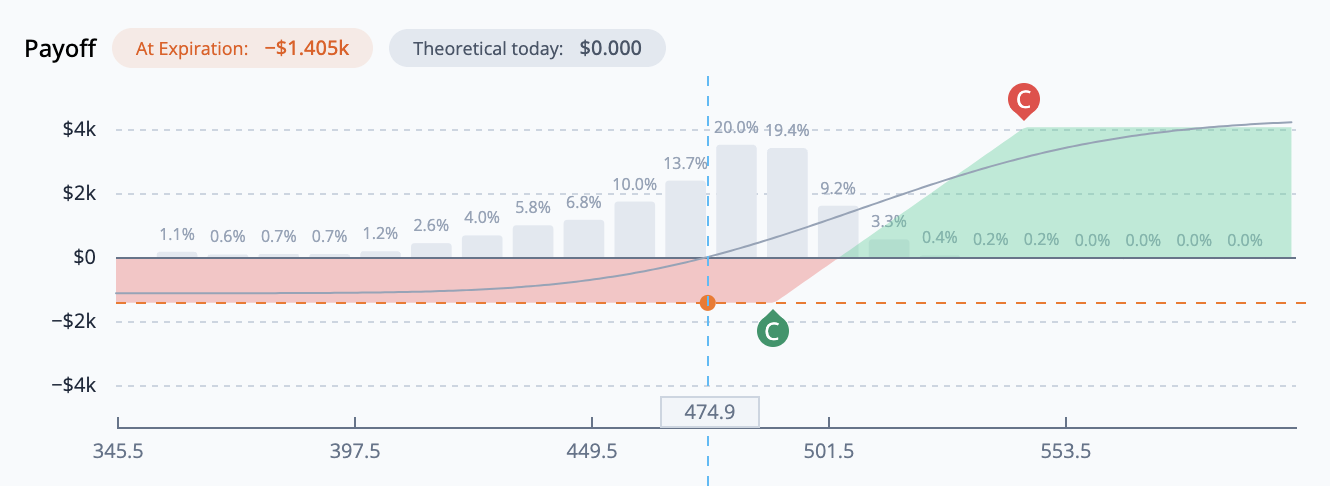
To normalize the distribution for periods of extreme volatility, returns are adjusted using implied volatility at the time of the observation. For example, if SPY was trading $100 with a 30% IV a 1% move would be adjusted down now that SPY is $470 with a 10% IV. So that 1% move might go in the 0.5% bucket after making the adjustment. On the contrary, if the current IV is super high we would take the opposite approach: If a historical same DTE move was 0.25% with a 25% IV, and now the IV is 50% we would increase the percent move.
To calculate D%, we start by looking at each bucket and multiplying the probability by the terminal value of the trade at that point. Then, we add up all of those values to get a theoretical value. Finally, to calculate the edge, we divide this total by the options trade price or the minimum margin (see section below), whichever is greater.
A positive D% edge indicates that ORATS is forecasting a greater likelihood of the trade expiring "in-the-money" than the market.
Forecast edge
Our second theoretical edge (F%) focuses on forecasting the volatility surface. This is based on a combination of factors, including historical volatility and the forecasts for slope, deriv, and earnings effects. You can read more about how we forecast the volatility surface here.
We use our forecast of the volatility surface to calculate our own theoretical value for the price of the trade. If our value is lower than the market price (higher in the case of a credit), this is a positive edge - a benefit to the trader.
Smoothed edge
Lastly, our smoothed edge (S%) measures the distance between ORATS' proprietary SMV value and the price of the trade. If you remember from earlier lessons, our Smoothed Market Values (SMV) process helps line up put and call volatilities by looking at several contributing factors – interest rate assumptions, dividend assumptions, and liquidity – and then using a residual yield solved by applying put-call parity. With these volatilities now lined up, a "smoothed" line is drawn through the implied volatility skew for each expiration. We use this modified volatility surface to calculate a new price for the trade – our SMV price.
To calculate S%, we divide our SMV price by the market price (or minimum margin, whichever is greater). For a credit, one is subtracted by the ratio and for a debit the ratio is taken away from one. The edge is positive for a theoretical benefit to the trader.
Minimum margin
Note that for all edge calculations (D%, F%, and S%), the minimum divisor is the greater of the options trade price and the minimum margin for a trade. The minimum margin is $0.375 times the number of options in a trade. For example, a single leg option has a minimum margin of $0.375. A vertical has two options for a minimum of $0.75. A three option trade like a call 1x2 (1call x -2calls) or put spread collar (1put x -1put x -1call) has $1.125 minimum divisor. A four option trade like an iron condor or butterfly (1 x -2 x 1) has a minimum margin of $1.50.
Additional filters
Rank weightings
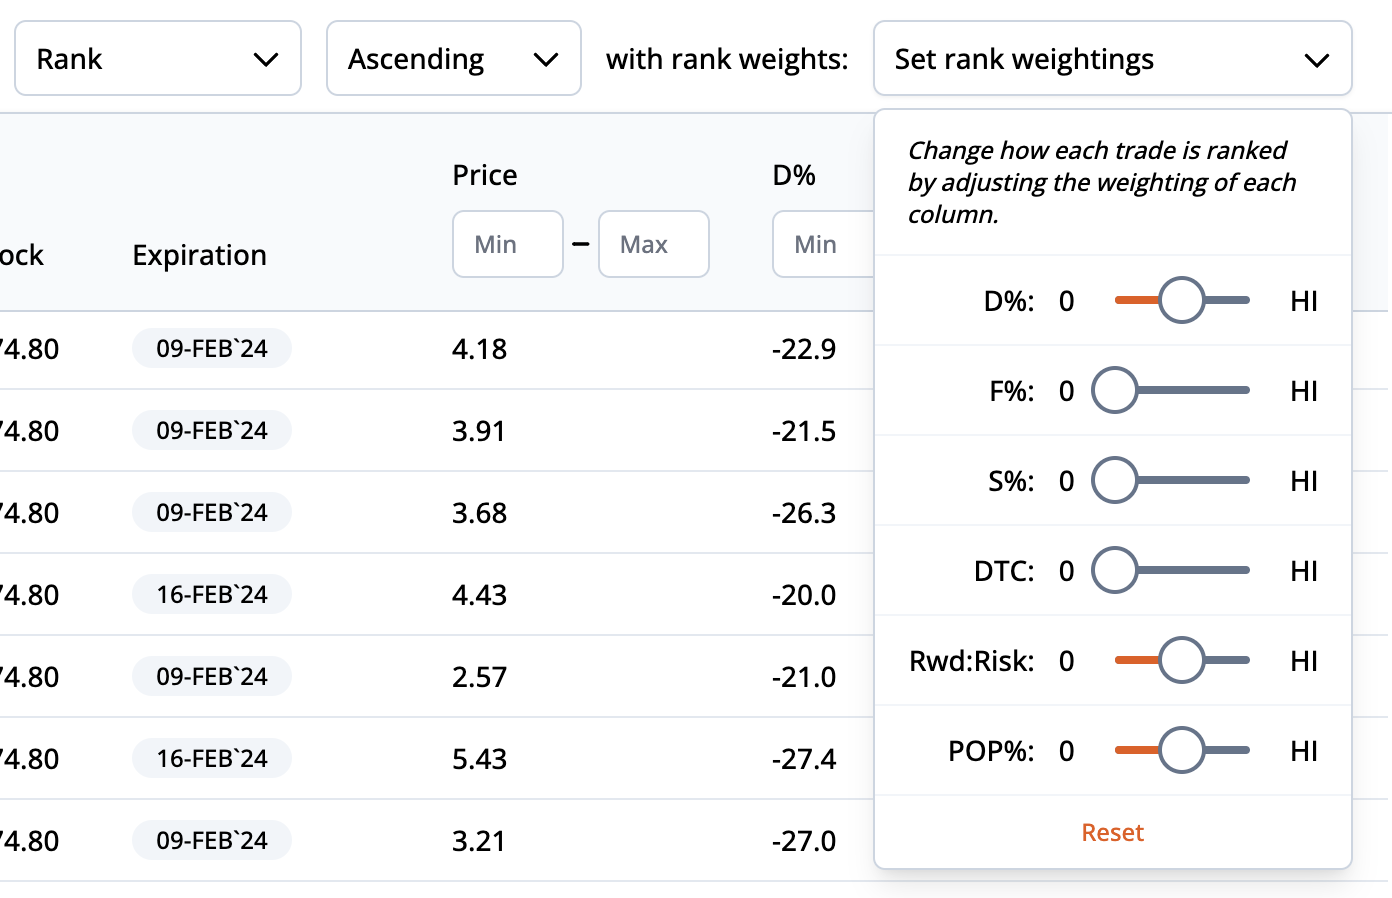
When filtering through hundreds of options trades, it's important to have a ranking system built in. You could, of course, sort by a specific column, but your trade selection becomes much more powerful when you incorporate rank weightings. Rank weightings consider the varying importance of six different popular column filters: D%, F%, S%, delta cost, reward to risk, and probability of profit. By dragging the sliders left and right, you can change how each trade is ranked based on how benefecial or detrimental the column reading is.
Column filters
In addition to the three theoretical edges described above, ORATS presents an additional 20 columns in the Option Scanner:
Price: The price of the trade is the net mid point of the bid-ask quotes. Negative prices are credits. Positives are debits.
DTC (delta cost): Delta Cost is a proprietary formula for evaluating the cost of delta. Delta is a benefit to long options and a detrement to short options. The Delta Cost should be minimized if buying and maximized if selling. For buying, the smallest positive number is the best Delta Cost. For selling, the most negative (smallest) number is the best Delta Cost. Delta Cost is positively related to trade price. Delta Cost is negatively related to absolute delta, stock price, volatility, and time.
Rwd:risk: Reward to risk is the maximum gain from the terminal value of the trade minus the price over three standard deviations divided by the maximum loss.
POP%: Probability of profit is the area under the distribution sum of the probabilities that result in a positive profit.
Max gain: The maximum amount, in dollars, you would profit from this trade if this trade was closed at expiration. For trades with an unlimited max gain, we show a dollar value equal to three standard deviations of upside potential.
Max loss: The maximum amount, in dollars, you would lose from this trade if this trade was closed at expiration. For trades with an unlimited max loss, we show a dollar value equal to three standard deviations of downside risk.
Delta: The total delta of the trade is the current sum of the options deltas. Delta is the change in the price of the option given a one dollar increase in the stock.
Gamma: The total gamma of the trade is the current sum of the options gammas. Gamma is the change in the delta of the option given a one dollar increase in the stock.
Theta: The total theta of the trade is the current sum of the options thetas. Theta is the change in the price of the option given a one day passage of time.
Vega: The total vega of the trade is the current sum of the options vegas. Vega is the change in the price of the option given a one percentage point increase in the implied volatility.
IV: The implied volatility of the trade is the current weighted average by number of contracts ratio of options implied volatility.
DTE: The number of days until expiration for the trade.
Breakeven(s): Breakeven points of the trade are where the trade terminal profit equals zero across a three standard deviation range.
Open interest: The open interest of each leg corresponds to the strikes order.
Volume: The current day's volume of each leg of the trade corresponds to the strikes order.
Ask-bid: The sum of the asks minus the bids for each leg of the trade.
Mkt width %: Market width in percent of stock price: (ask - bid) / stock price * 100.
Price %: The price divided by the stock price * 100.
Next dividend: The date the company is expected to report it's next dividend.
Next earnings: The next expected earnings date for the company.